Overview
The reporting panel is a section or dashboard in eventbuizz where reporting agents can view, generate, and manage detailed reports. These reports typically show important data related to events, participants, or other activities, such as:
- Attendance numbers
- Participant engagement
- Sales or financial data
- Event feedback
In the reporting panel, you can choose what data to include, customize how it’s displayed, and filter the information to get insights. It helps you analyze and track key details about your events.
Prerequisites for Working with reporting agents
For accessing the events through reporting panel first, need to make sure events are assigned to the reporting agent, and the credentials are shared to the agent. For more detail how to create and assign events to reporting agent, please click here.
How to access reporting panel:
There are typically two ways to access the reporting panel:
- Access reporting panel through URL directly: Event organizers usually provide a direct link to the reporting agent. Users can click on this link, (https://report.eventbuizz.com/auth/login) which leads directly to the login page.
- Access reporting panel through email invitation: Once an admin has been created, an email reporting agent email template invite with a link to the reporting panel will be sent from which they can gain access to the platform with his username and password.
Login into reporting panel
After accessing the reporting portal through the URL, reporting agent will give his own credentials and login into the portal:

Forgot password:
The “forgot password” functionality for reporting agents in a system like eventbuizz typically involves a series of steps to securely reset a user’s password. Here’s how it usually works:
1- Initiating Password Reset
The sales agent clicks on the “Forgot Password?” link on the login page, then the system prompts the user to enter their registered email address or username.

2- Verification:
- Email validation: The system checks if the entered email address is associated with an existing account.
- Notification: If the email is valid, the system sends a password reset email to the provided address. If not, it may inform the user that the email is not registered.

3- Password Reset Email: The email contains a unique, time-sensitive link (token) that the user can click to reset their password.

4- Verify token code: Please enter the reset password token that we have just sent to your registered email address and click verify button. The system verifies the token to ensure it is valid and has not expired.

5- Setting a New Password: The password reset page presents fields for entering a new password (and possibly confirming it).

6- Confirmation: Once the new password is submitted, the system updates the account with the new password and may display a confirmation message.

After login – access to dashboard
After logging in, the reporting agent will be directed to their dashboard. The dashboard is a central place where the agent can easily manage and generate reports of their assigned events. This reporting panel gives users an overview of event performance, ticket sales, and revenue, along with the ability to filter, search, and export data for further analysis.
There are three section which you see after login.
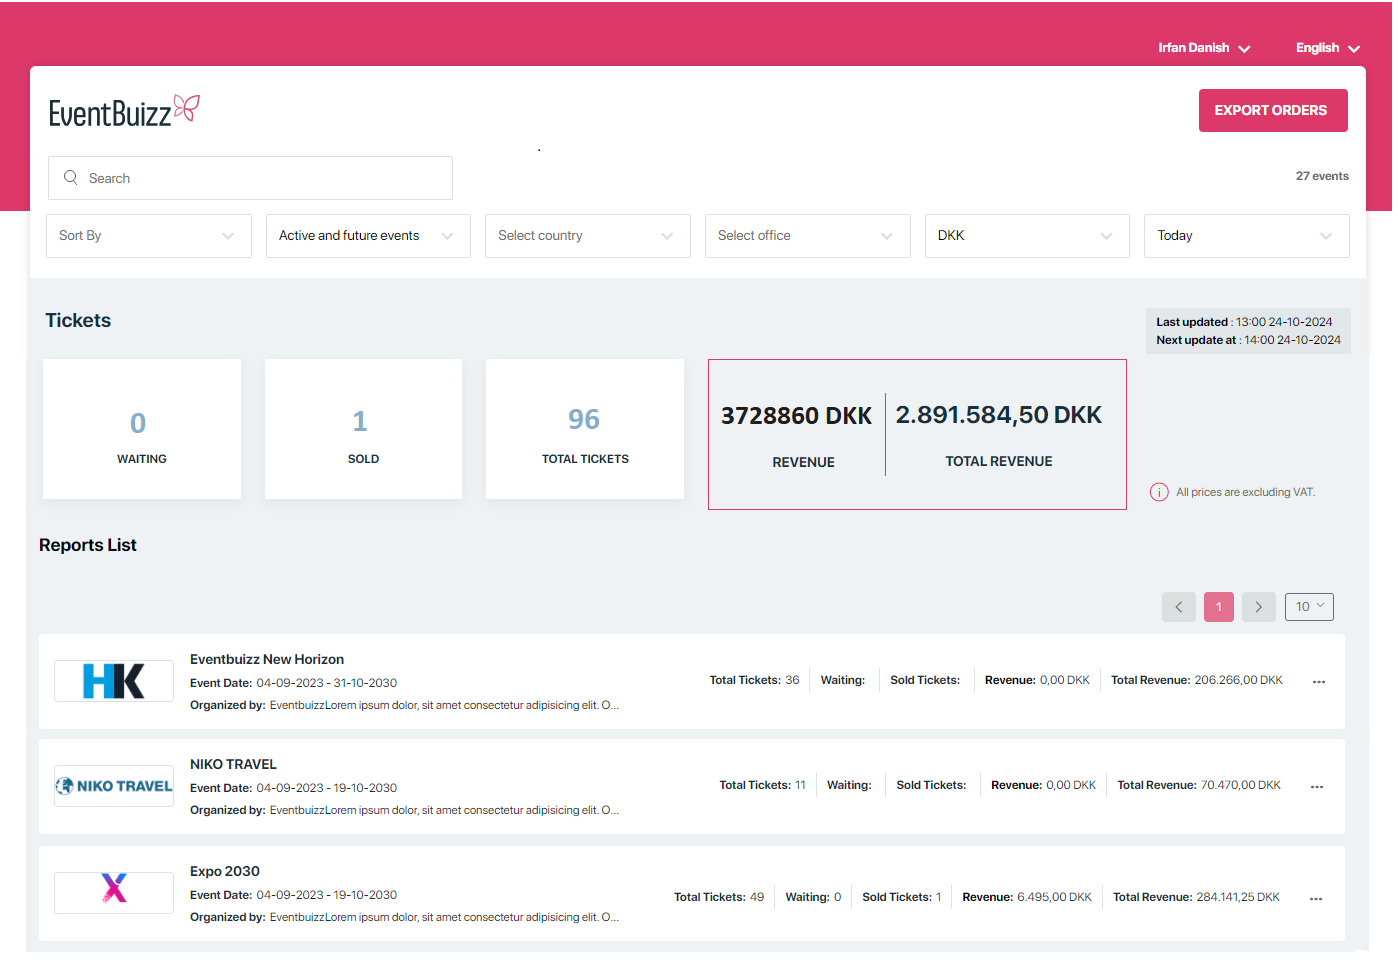
Tickets section
The stats that appear in the ticket section of a reporting panel are dynamically generated based on the various filters applied, such as Select Country, Select Office, Currency, Stats Filter (Date Range), and other customizable options like the Custom Range. These filters allow users to drill down into specific data points, refining the information displayed in the ticket section to reflect only the relevant stats.
- Total tickets: For each event, the agent will be able to see how many tickets are allowed (the total number of tickets that can be sold for the event).
- Waiting: The waiting list count shows people who are still waiting. They haven’t registered for the event yet, and they haven’t been removed from the event either. They’re just waiting for a spot or confirmation.
- Sold tickets: Sold tickets refer to the total number of tickets that have been purchased for an event.
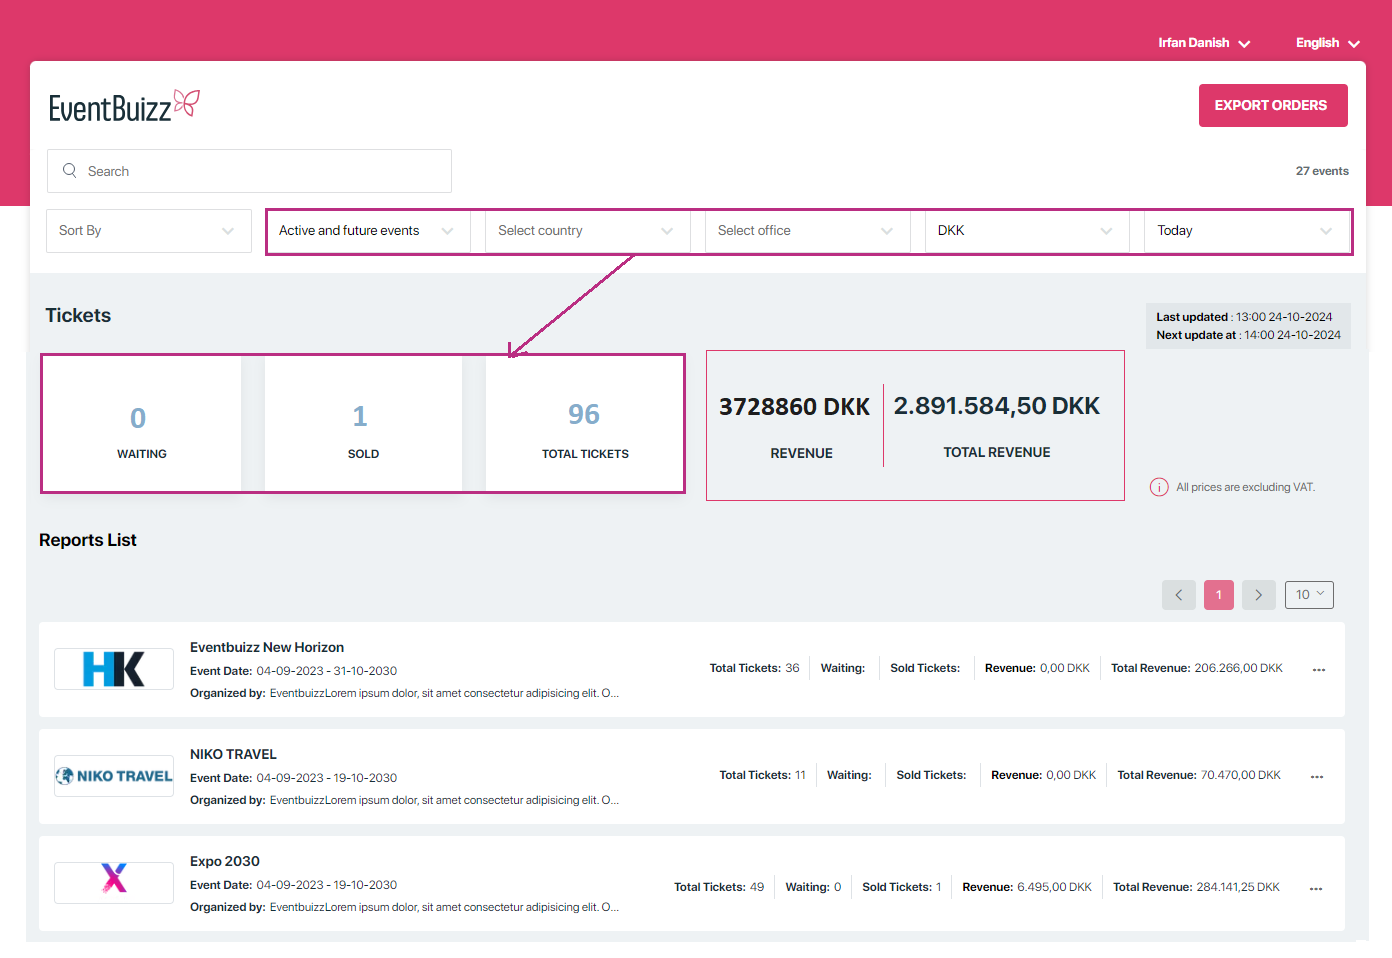
Revenue section
The revenue section in eventbuizz provides a summary of the revenue generated from ticket sales for events. It typically displays:
- Revenue:
- The filters at the top (like event date, country, or office) allow the user to narrow down specific events.
- Based on the filters you select, the revenue in this section will show how much money has been made from the tickets sold for those filtered events.
- Total revenue:
- The total revenue shows the combined amount of money expected or generated from all the events that the agent is responsible for.
- This means, no matter which events are selected or filtered, the total revenue will display the total income or potential income from all events assigned to the agent.
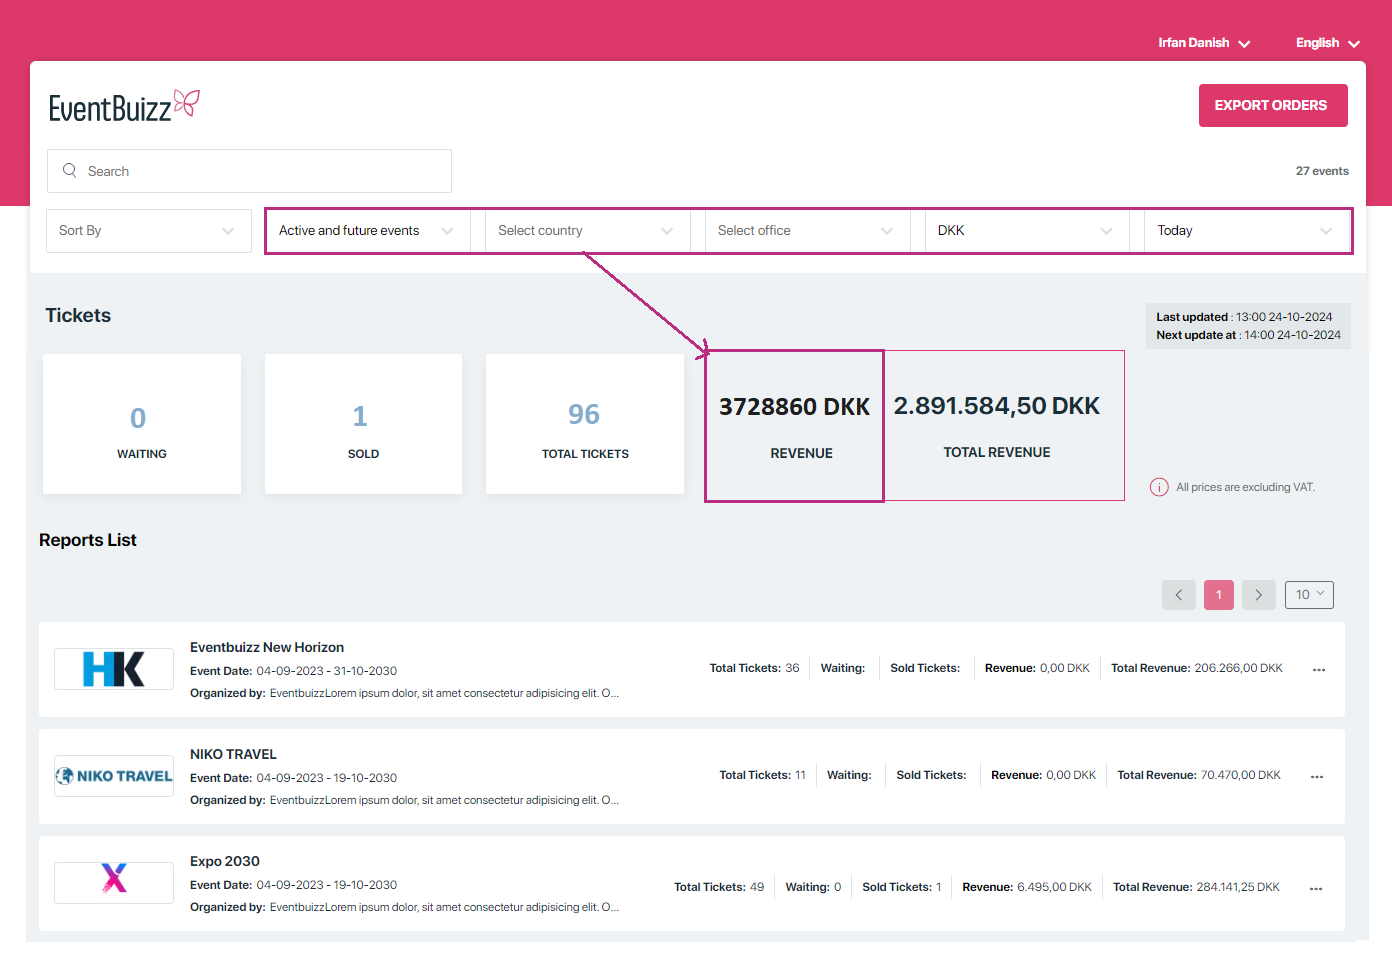
Reports list
In the Reports List section, all the events that are assigned to the report agent are shown. The stats that appear in the report list section of a reporting panel are dynamically generated based on the various filters applied, such as select country, select office, currency, stats filter (date range), and other customizable options like the custom range. This means the list will update and display only the events that match the selected filters, making it easier to focus on specific events or data.
- Total tickets: For each event, the agent will be able to see how many tickets are allowed (the total number of tickets that can be sold for the event).
- Waiting: They can also see how many tickets are left (the number of tickets that haven’t been sold yet). This helps the agent know the current status of ticket sales for each event.
- Sold tickets: Sold tickets refer to the total number of tickets that have been purchased for an event.
- Revenue: This shows the revenue from sold tickets
- Total revenue: This is the total expected revenue or the total revenue generated.

Additional feature (Export Order)
When we export data from here, it collects information from all events.

During the export process, we have two options:
-
All (Includes Group Booking) – This option exports all events’ data, including information about group bookings. It collects every booking, whether individual or group, so we get a complete overview of all bookings made across events.
-
Unique Invoice with Header Sum – This option creates a unique invoice for each event, adding up the total amount in a header section. It’s a summary-focused export, showing only the key details, with the total amount displayed at the top, giving a clear view of the overall charges without listing each booking separately.
You can choose either option depending on whether you need detailed booking data (with group bookings included) or a summarized view for quick reference.

The difference between all group booking and Unique invoice with header sum is:

There are two options when you click on the three dots icon.

viewdetailsreportslist
View details
View details
If you want to see the details of a specific event, just click on view details. This will open all the information related to that event, allowing you to review details about the event.
There are three different sections:
Ticket widgets
The ticket details show all forms, including their waiting, sold, left, and total tickets. Next to each form, it also shows how much time is left until the registration date ends. For any form whose registration date has already ended, it will display “date ended.”
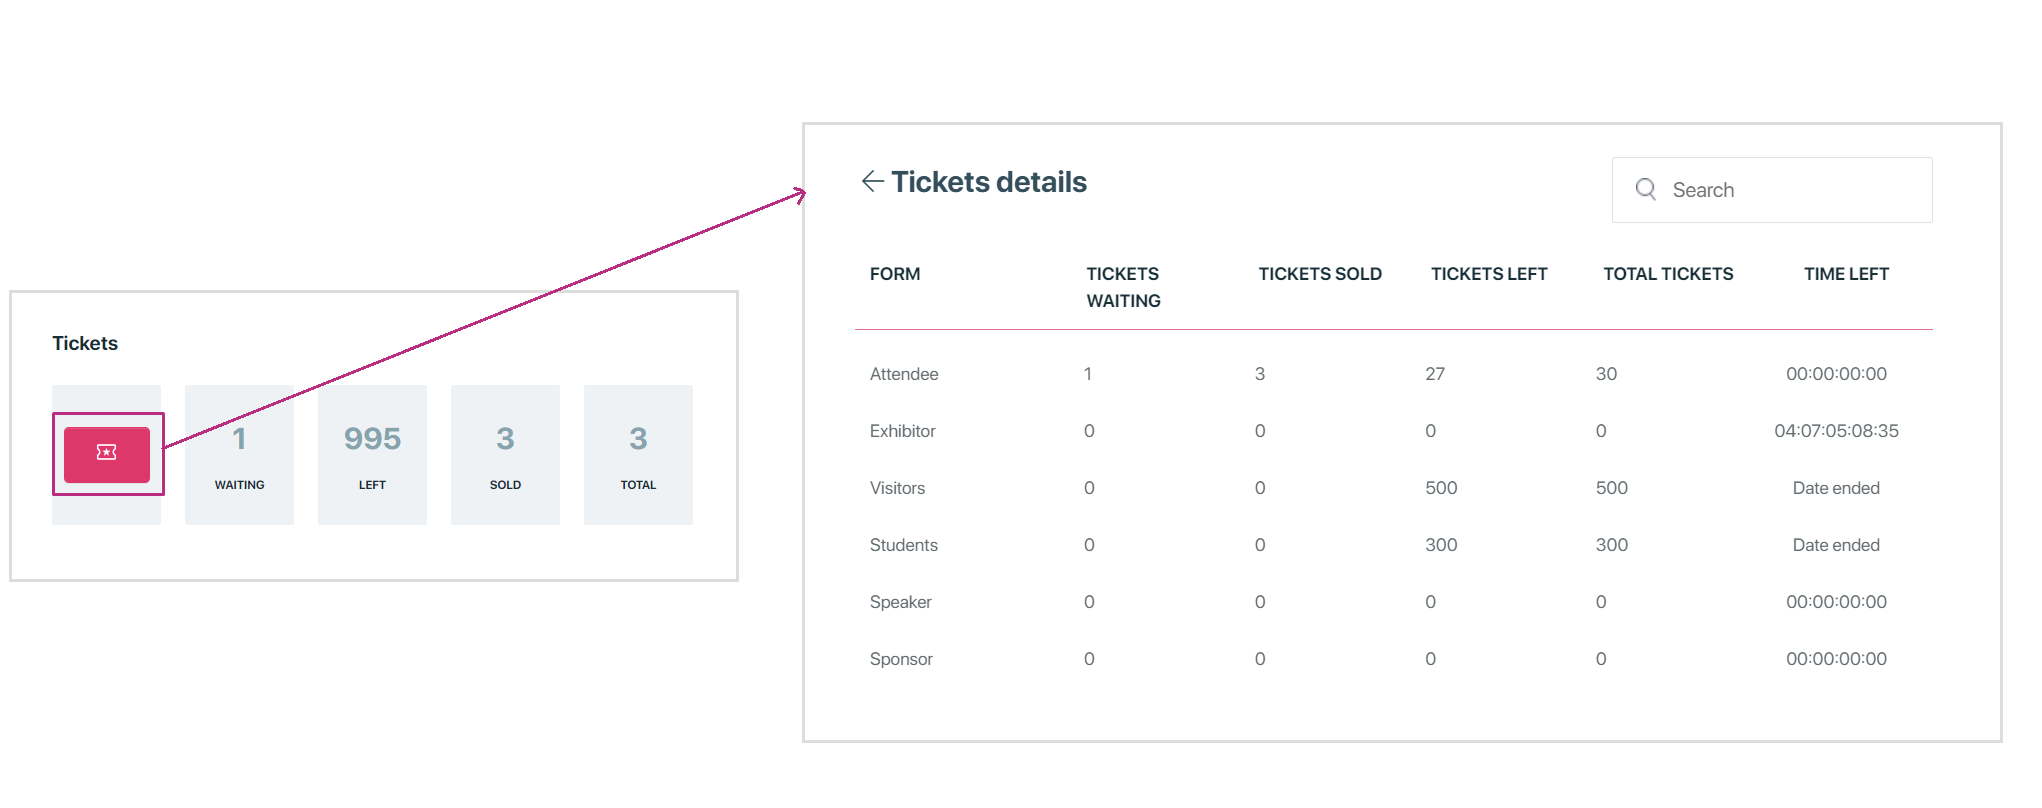
The outer count of tickets is the sum of all forms tickets.

Event revenue
The revenue section in eventbuizz provides a summary of the revenue generated from ticket sales for events. It typically displays:
Revenue:
- The stats filter allow the user to narrow down specific time period revenue.
Total revenue:
- The total revenue shows the combined amount of money regardless of any filter
- This means, no matter which stats filter is selected the total revenue will display the total income or potential income from all time period.

Order list
An order list typically refers to a list of orders placed by users in an event. This list may include details such as the order ID, the name, email of the user who placed the order, date, job title, company, title, amount, sales agent and payment status. This feature helps reporting agent keep track of all transactions and orders efficiently.

We can sort all fields in ascending and descending order by clicking on arrows.

We have a column named sales agent. This column tells us where the order came from.
- If the order was made through the registration site, it will say “registration site” in this column.
- If the order was made by a sales agent, the name of that sales agent will appear in this column instead.

exportorderreportlist
Export orders
Export orders:
The export orders button in the reporting panel allows users to download or export the order details for events. When you click this button, it generates a file (usually in formats like CSV or Excel).

Event listing and filtering
The event listing also provides a comprehensive listing of events with various filtering and sorting options:
Sorting options:
- Event name: Arrange the list alphabetically by the name of the event.
- Organizer name: Sort alphabetically by organizer name.
- Start date: Sort events based on their start date, either chronologically or reverse chronologically.
- End date: Order events by their end date, from earliest to latest or vice versa.
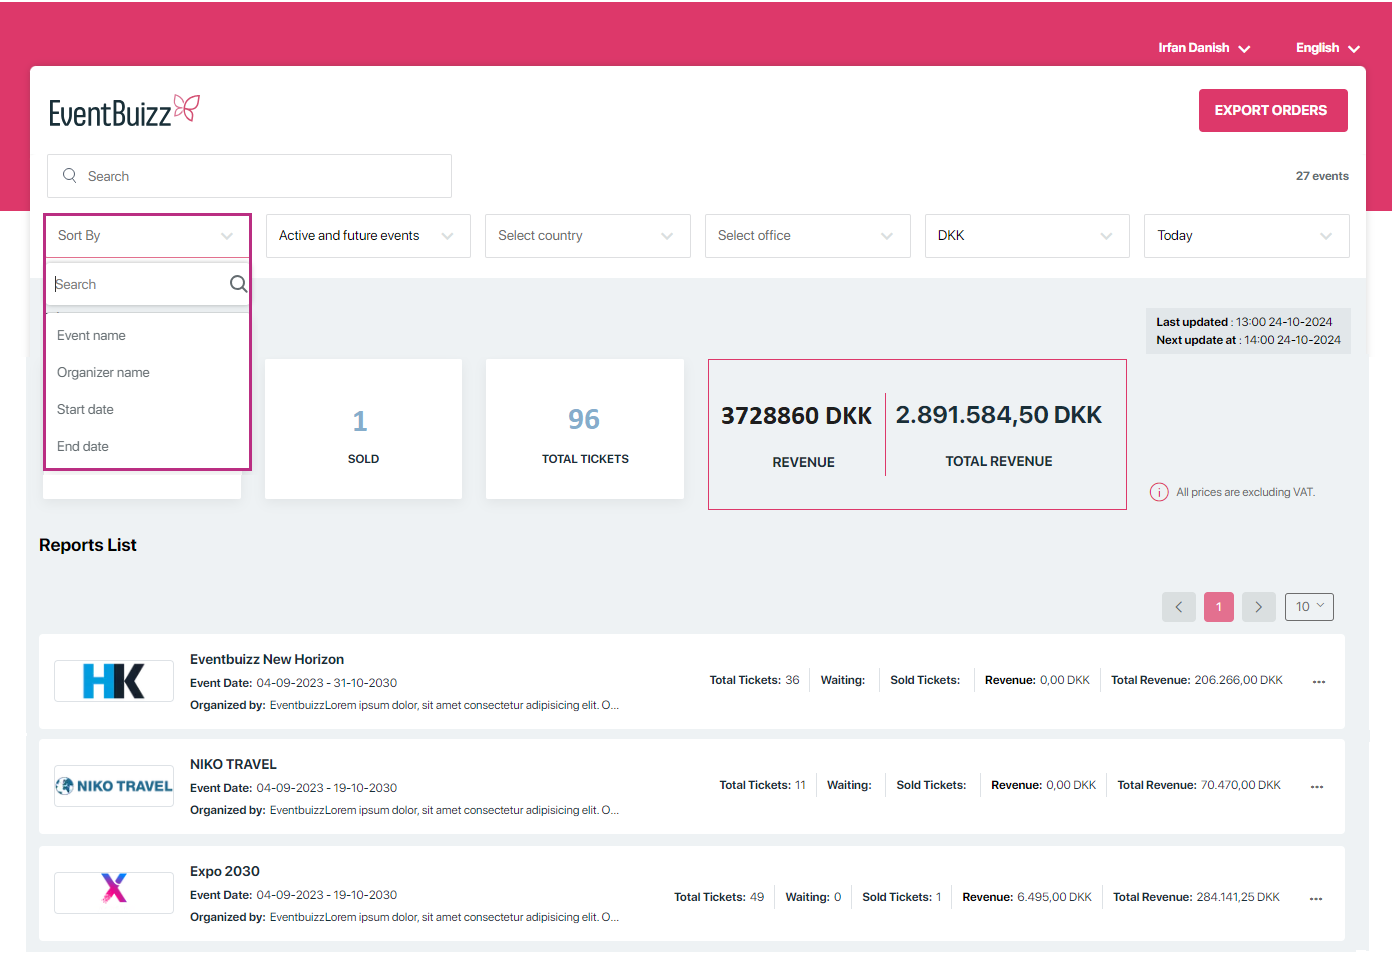
Filtering options
Search:
Use a search bar to where users can type in keywords to find events by name for quickly locating specific events when the exact name or part of it is known.


After searching any event name, it will search base on the entered name.

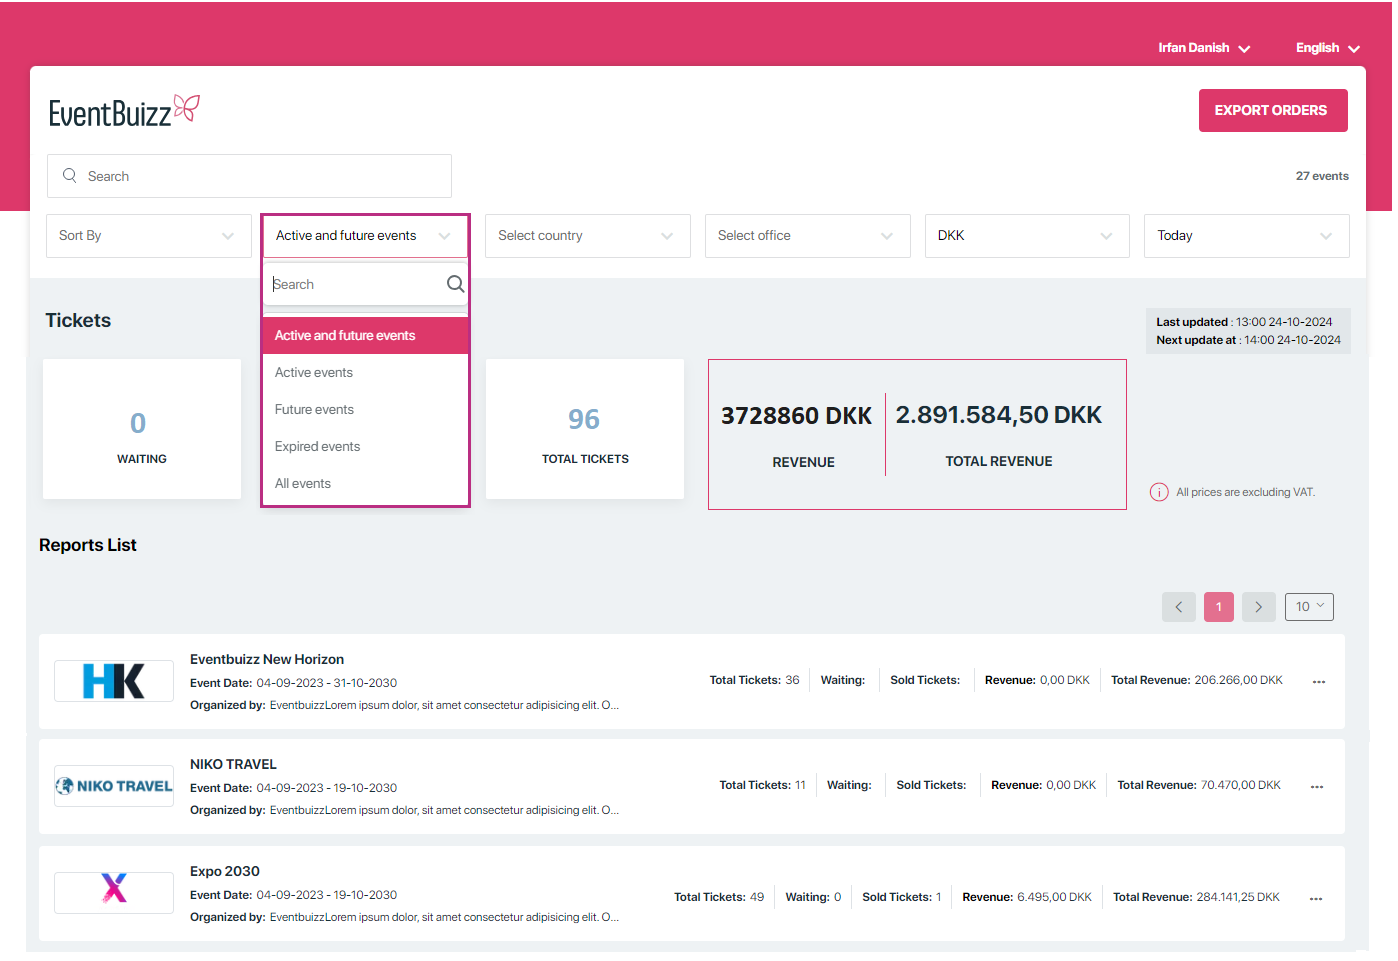
Additionally on reporting portal event listing, organizer have the access on different filtering options, detail of each available filtering option given below:
- Active and future events: Show only events that are currently active or scheduled to take place in the future.
- All events: View a complete list of all events, regardless of their status (active, expired, etc.).
- Active events: Highlight events that are currently ongoing. Ideal for checking which events are happening right now.
- Expired events: List events that have already passed their end date.
- Future events: Display events that are scheduled to occur after the current date.
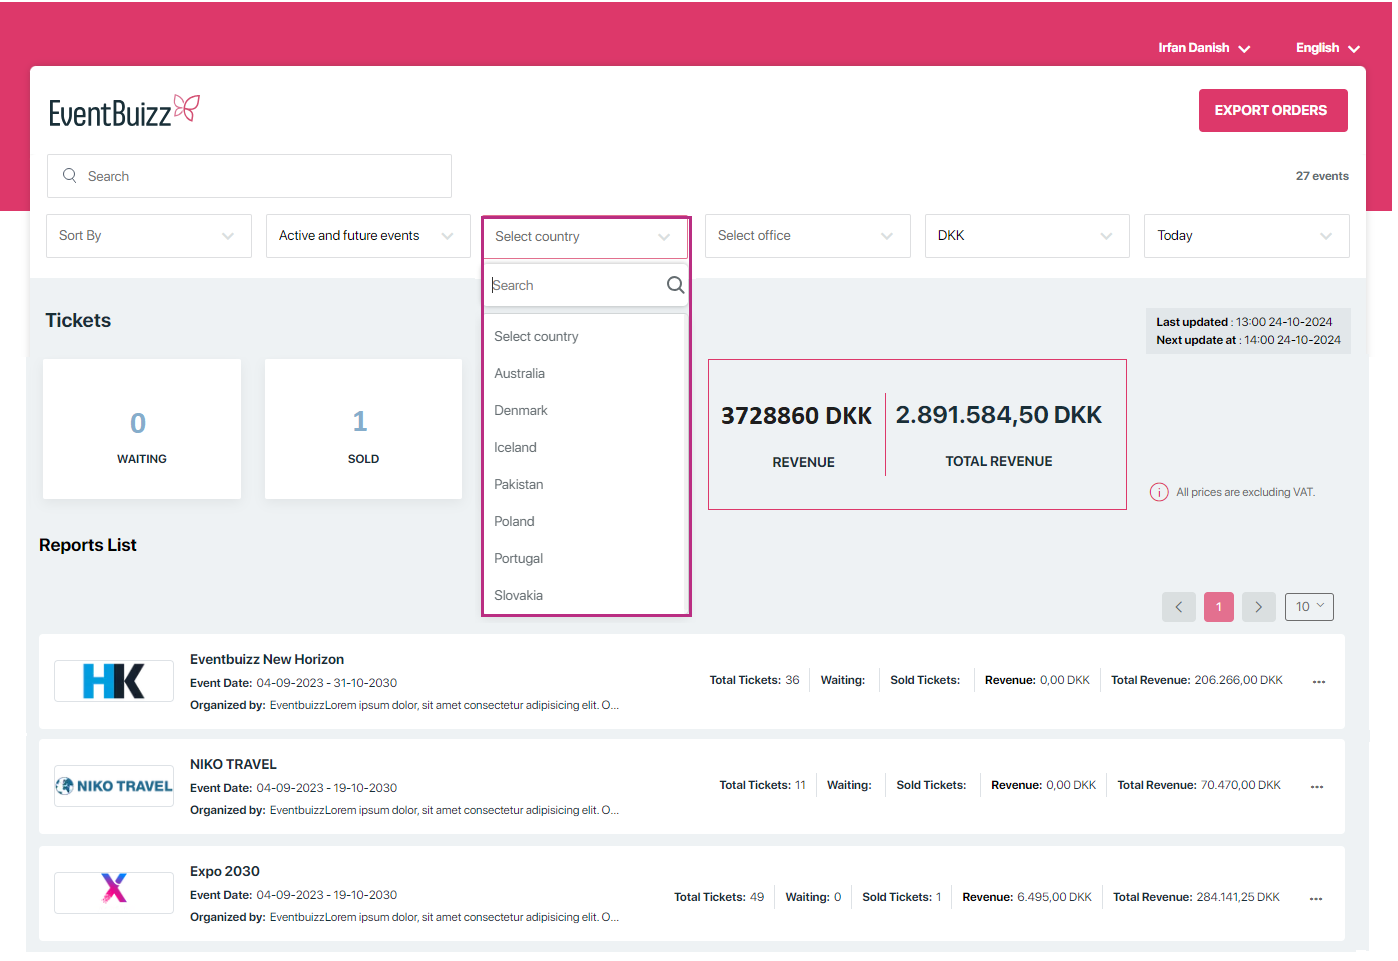
Select Country:
The “Select Country” option in a reporting panel is essential for organizations that operate in multiple regions. It empowers users to filter and analyze data effectively the report data based on a specific country.
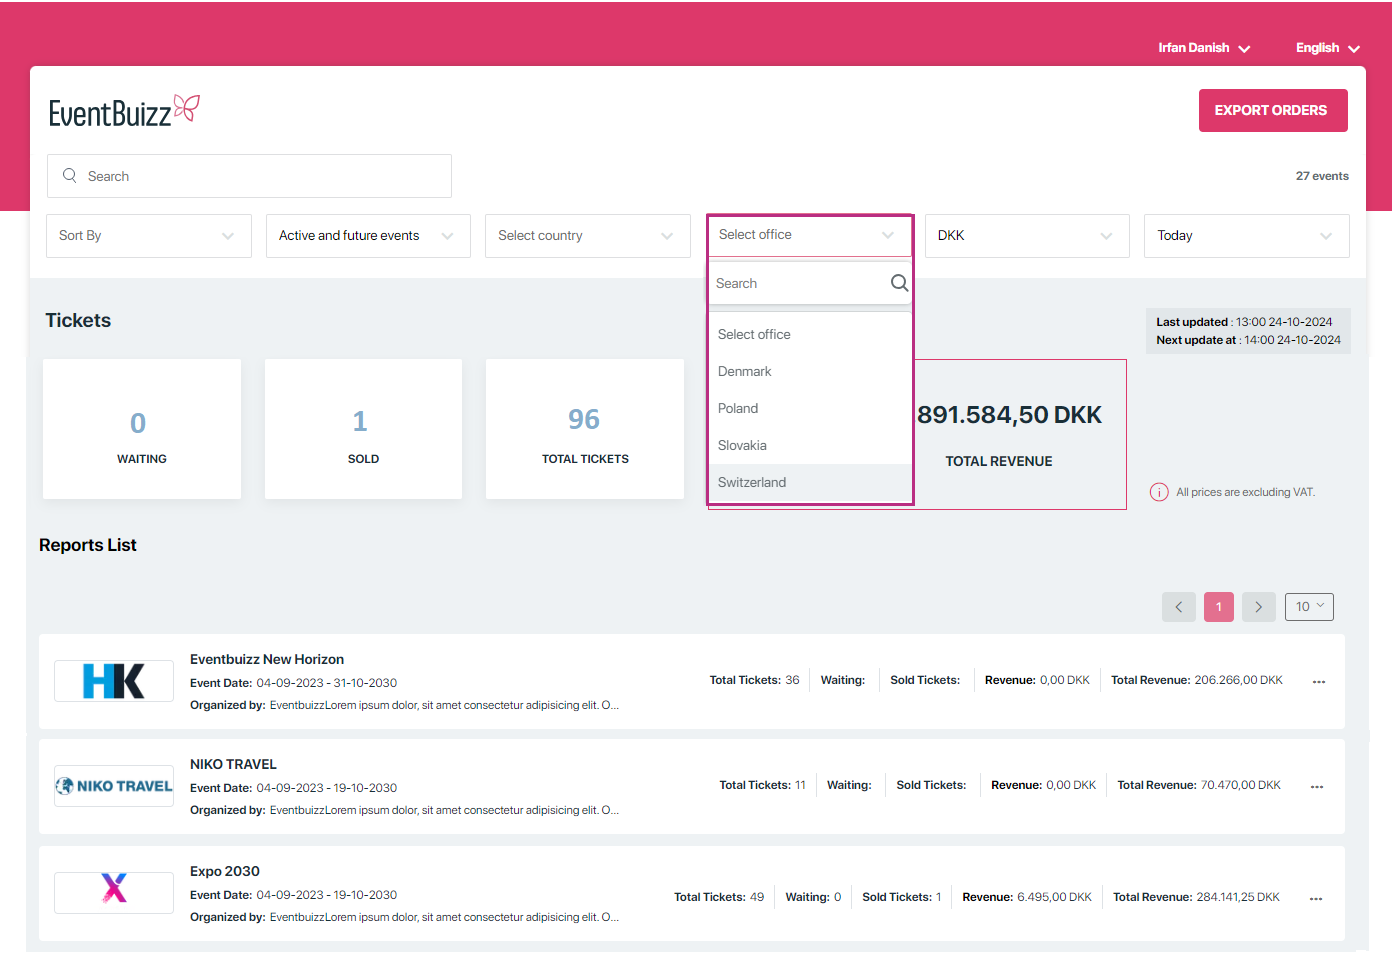
Select office
Similar to the country filter, this option lets users select a specific office or branch within a company. It helps in narrowing down the data to a particular location, allowing for more localized analysis and reporting.
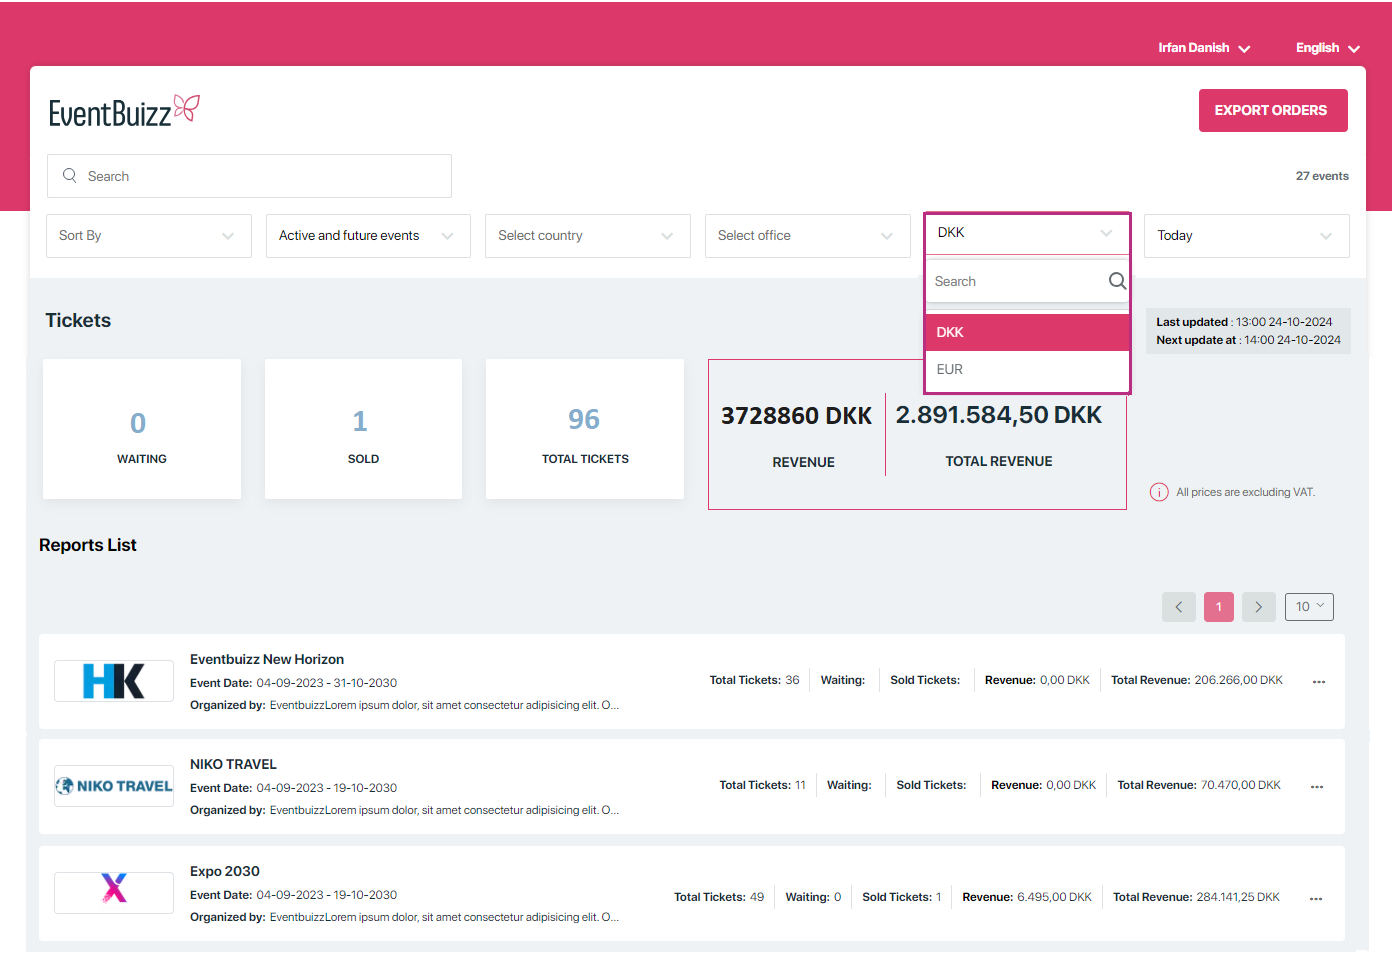
Currency:
This filter enables users to view financial data in a specific currency. It’s useful for organizations operating in multiple countries with different currencies, as it allows for easier comparison and analysis of financial performance.
Stats filter
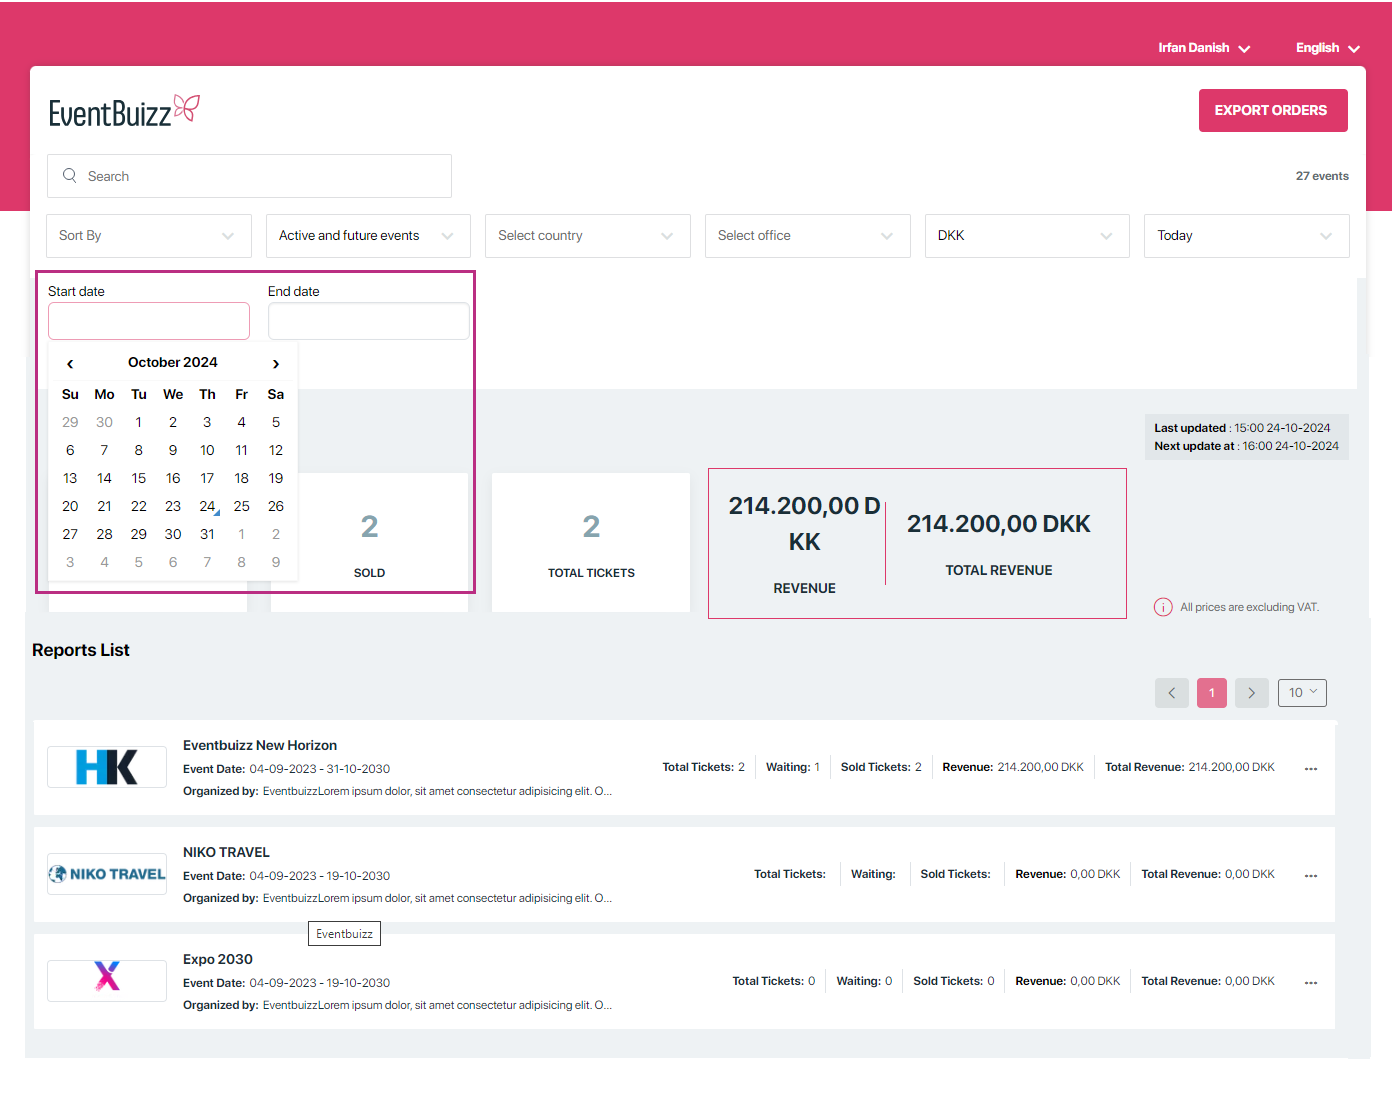
The Stats filter in a reporting panel allows users to customize which metrics or statistics are displayed, and one of its key features is the ability to filter data based on different time periods. Specifically focusing on common time-based filters like this week, previous week, previous month, this month, and custom range:

Custom range filter
The custom range filter is designed for users who need specific time frames that don’t fit the standard time options. It allows complete control over the period for which you want to view the data.
The custom range filter is typically presented as two date fields: “start date” and “end date.” Users can input the desired start and end dates either by typing them in or selecting from a calendar interface.
Once the start and end dates are selected, the reporting system dynamically updates to show only the data that falls within the selected date range.
