Polls are used to gather real-time responses from attendees during an event. This can be particularly useful for engaging the audience, driving interaction, and collecting instant feedback on various topics. Creating a Poll or a Quiz, can both be used before, during and after your event. They can be made on the fly or in advance.
With just a few steps, you can hide or preschedule the poll, making it visible for your attendees at the exact time you want it. If you are posing questions not related to a particular program session, you should create a event survey instead.
Surveys are typically more extensive than polls and are used to collect detailed feedback before, during, or after the event. They are a crucial tool for understanding attendee satisfaction and gathering insights for future improvements.
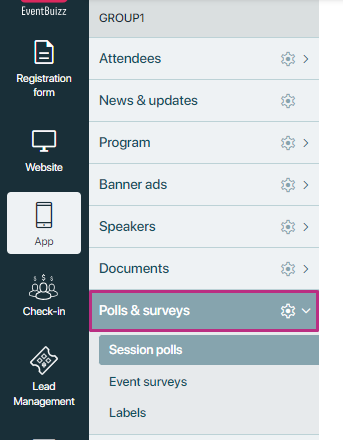
To set up a survey/poll, go to Apps -> Polls & Survey
Important Note:
If the program module is OFF and my program is ON, only those polls will be shown to the attendees that they have marked as favorite.
We also have a permission in programs called “Validate session check-in for voting.” If this setting is ON for a program, it will check that only those attendees can answer the polls who have checked in for that program.
We have following options in Polls/ Surveys:
addpollssurveys
Add Polls and Surveys
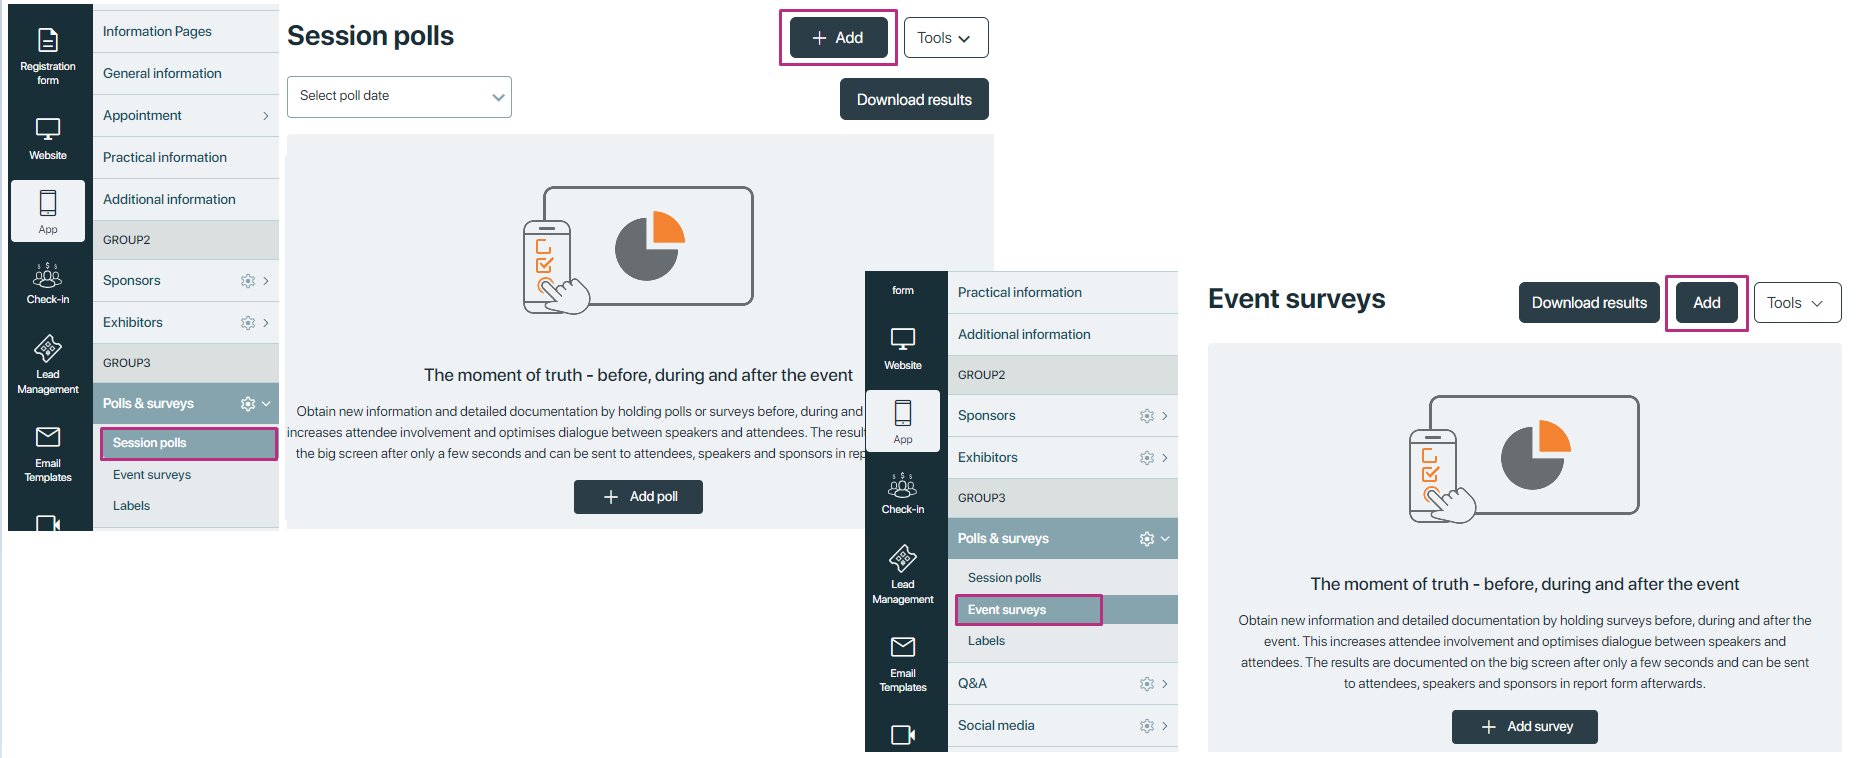
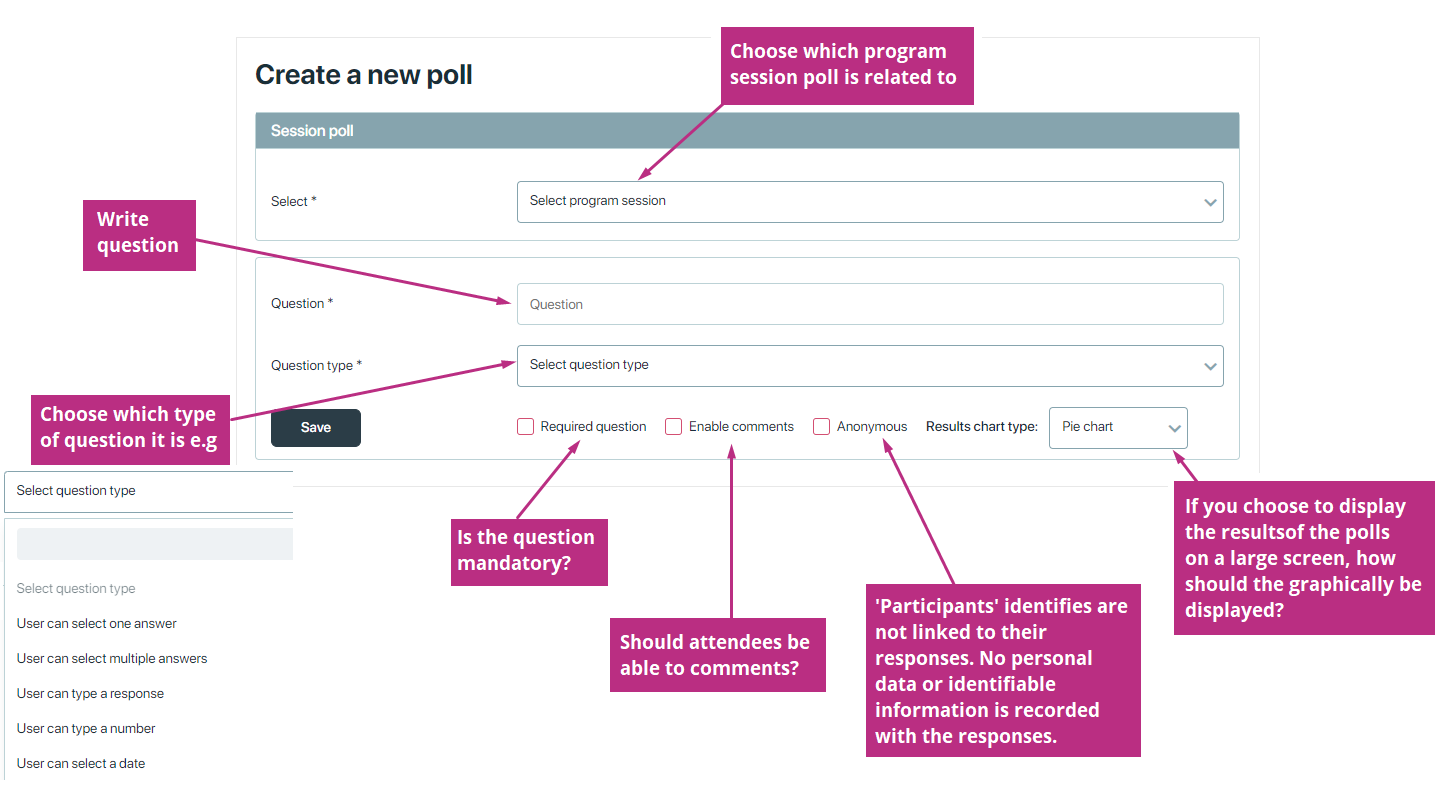
To set up a polls and survey, Navigate through Apps -> Polls and Survey -> Click on the button “Add” to create a new poll/ survey. Enter the title of your poll.
How to Choose Question Types
Polls/ Survey offers ten different question types. Here’s what each one does:
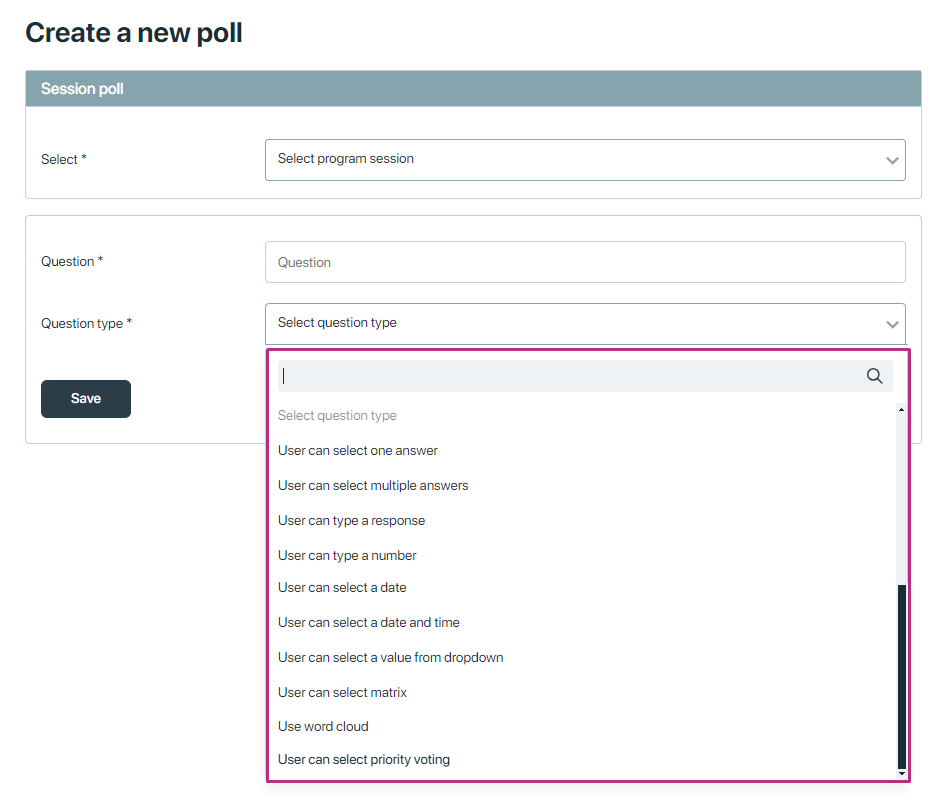
Single type question
A one selection question, often implemented using radio buttons, is a type of multiple-choice question that allows respondents to choose only one option from a list of predefined answers. This type of question is particularly useful when you want to ensure that attendees select the most relevant or preferred choice among several alternatives.
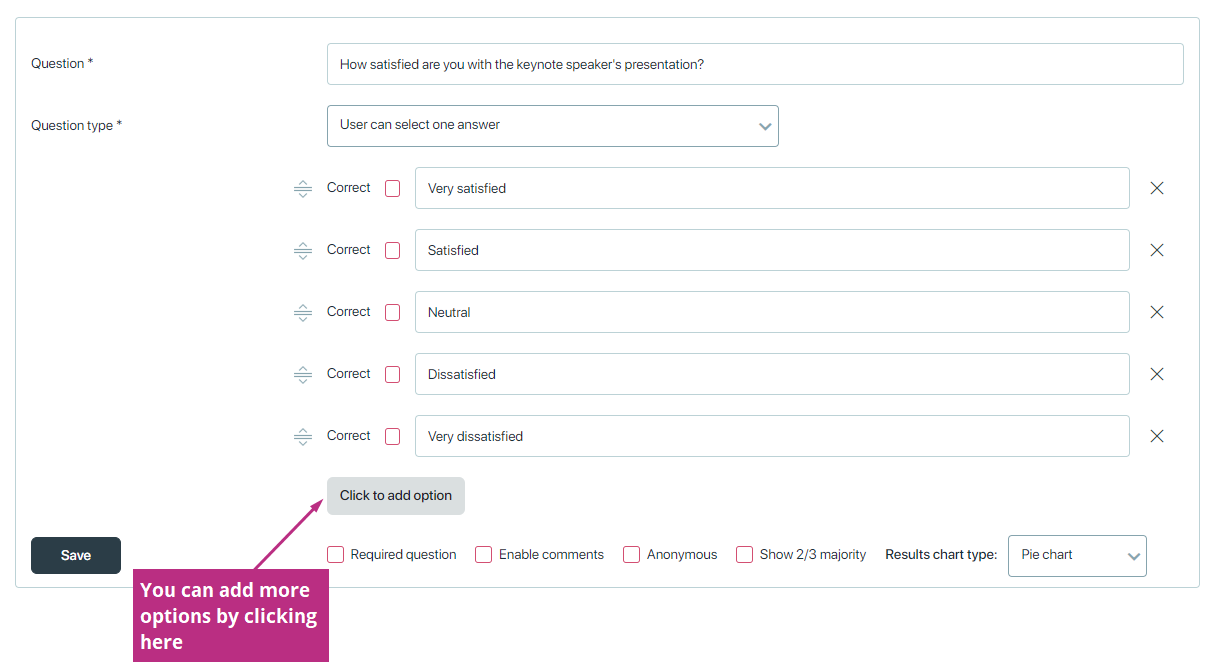
Multiple Type Question
Multiple-choice questions can be structured to allow either single or multiple selections from a predefined list of options. These questions are highly effective for collecting structured and specific information from attendees. This question is useful where multiple answers are possible or expected.
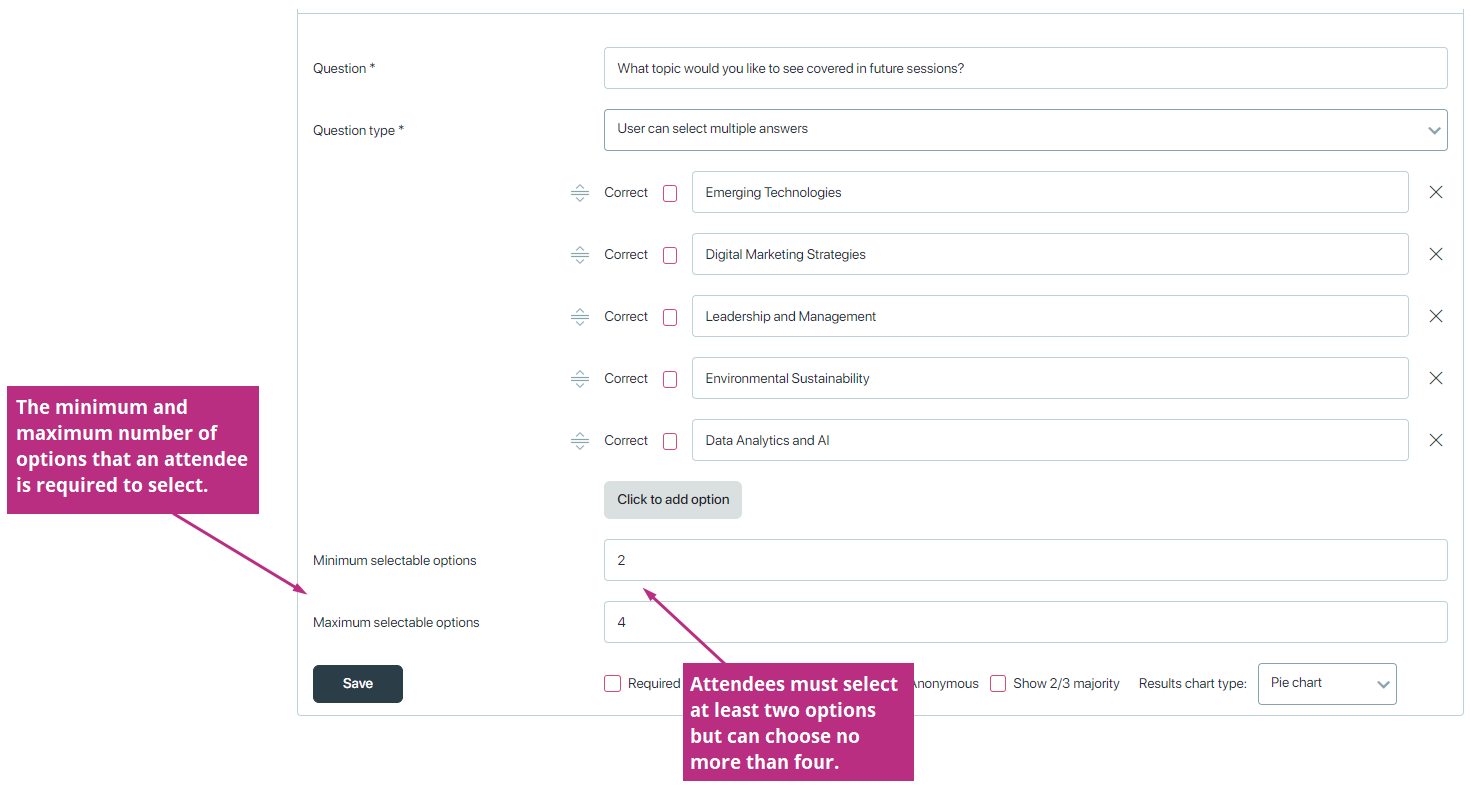
Response type question
A “response question” typically refers to open-ended questions that allow attendees to provide detailed, qualitative answers. These questions can be used to gather specific information, preferences, or feedback from attendees.

Number type question
A “number type question” is a type of question that prompts respondents to input numerical data as their response. This question type is useful for collecting quantitative information from attendees, such as age, years of experience, or numerical ratings.

Date type question
A “date type question” is a type of question that prompts respondents to input a specific date as their response. This question type is useful for collecting information related to dates, such as event preferences, availability, or important dates.

Date and time question
A “Date and Time” question is a type of question that prompts respondents to input both a specific date and time as their response. This question type is particularly useful for collecting information related to scheduling events, appointments, or meetings at specific times.

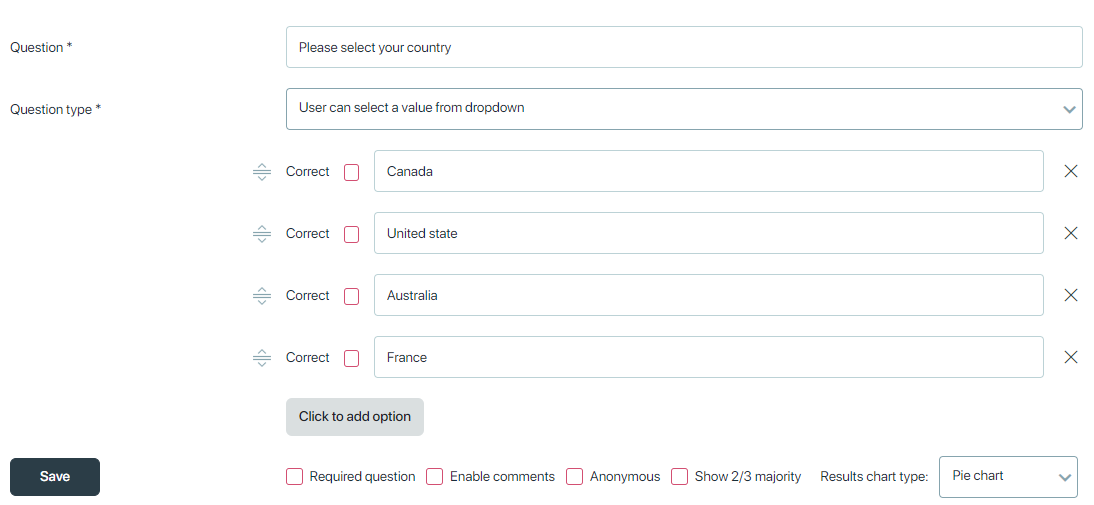
Dropdown question
A “Dropdown” question is a type of question that presents respondents with a list of predefined options from which they can select a single choice. This question type is useful for scenarios where you want to provide a compact and structured list of choices to respondents.
Matrix type question
A “Matrix” question is a type of question that allows respondents to provide multiple responses to a set of related statements or questions. This question type is useful for gathering feedback or opinions on multiple aspects of a topic in a structured format.
- ‘Options’ are your vertical subjects
- ‘Column’ are your horizontal value
- Structured Format: Presents a grid or matrix of related statements or questions.
- Multiple Responses: Respondents can provide a rating or answer for each statement or question in the matrix.
- Compact Presentation: Allows for the presentation of multiple items in a condensed format
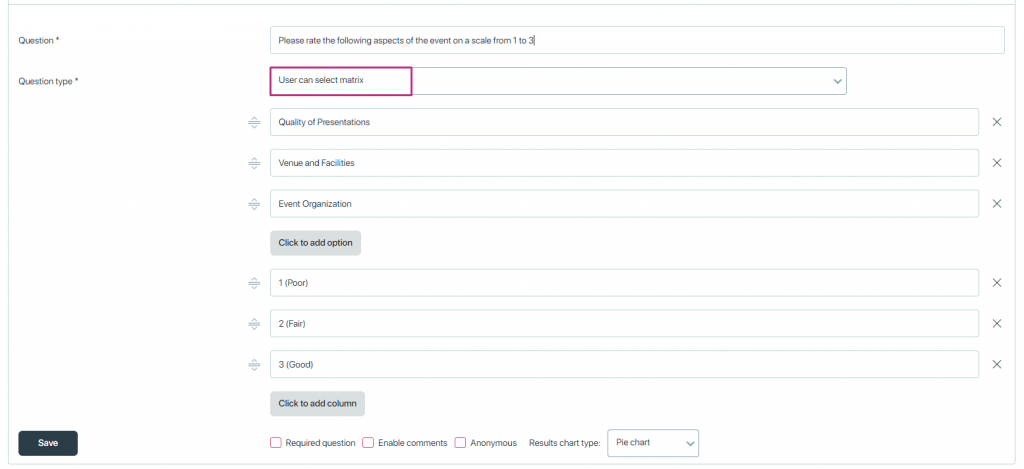
This is how matrix question looks on webapp.

Word cloud question
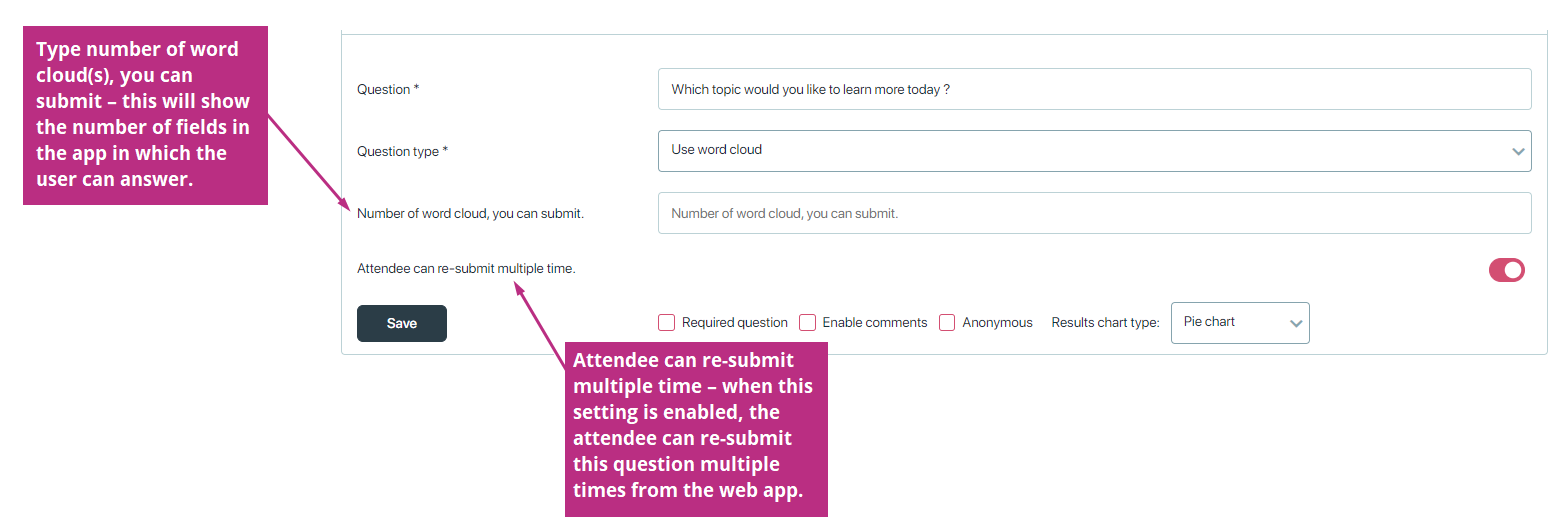
A word cloud question is a type of open-ended question where respondents submit words or short phrases in response to a prompt. The responses are then visualized as a word cloud, where the size of each word or phrase corresponds to its frequency of mention among all responses. This helps to quickly identify the most common themes or sentiments from the participants.
Type number of word cloud(s), you can submit – this will show the number of fields in the app in which the user can answer.
Setting: Attendee can re-submit multiple time – when this setting is enabled, the attendee can re-submit this question multiple times from the web app.
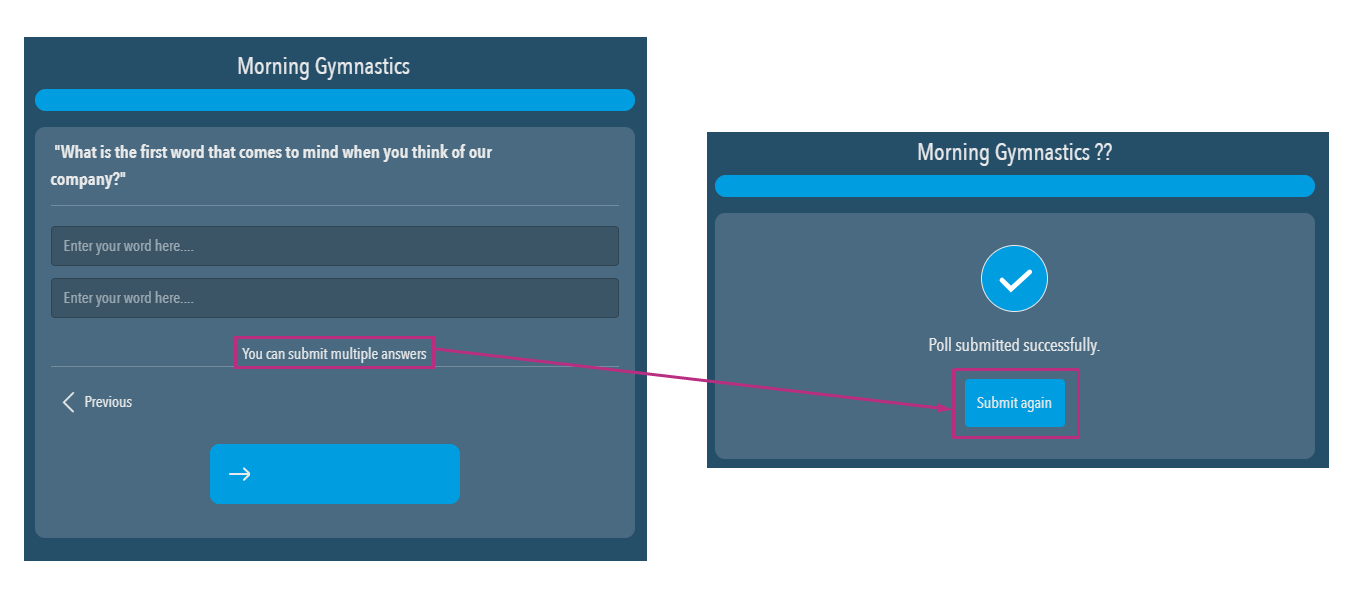
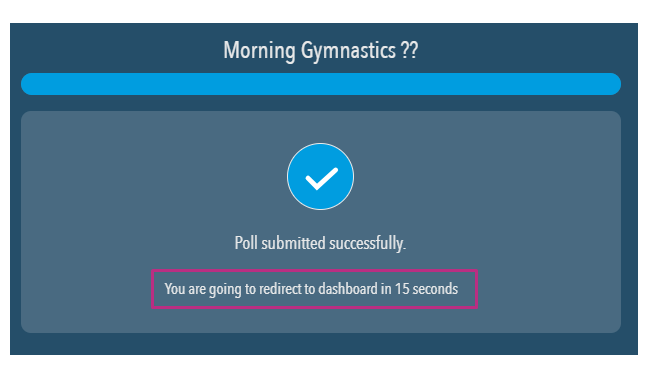
If the option for attendees to submit multiple responses is enabled, they will be prompted to answer the word cloud question again. However, if the setting to allow resubmission is turned off, the system will initiate a countdown and then redirect attendees to the dashboard.
Priority question
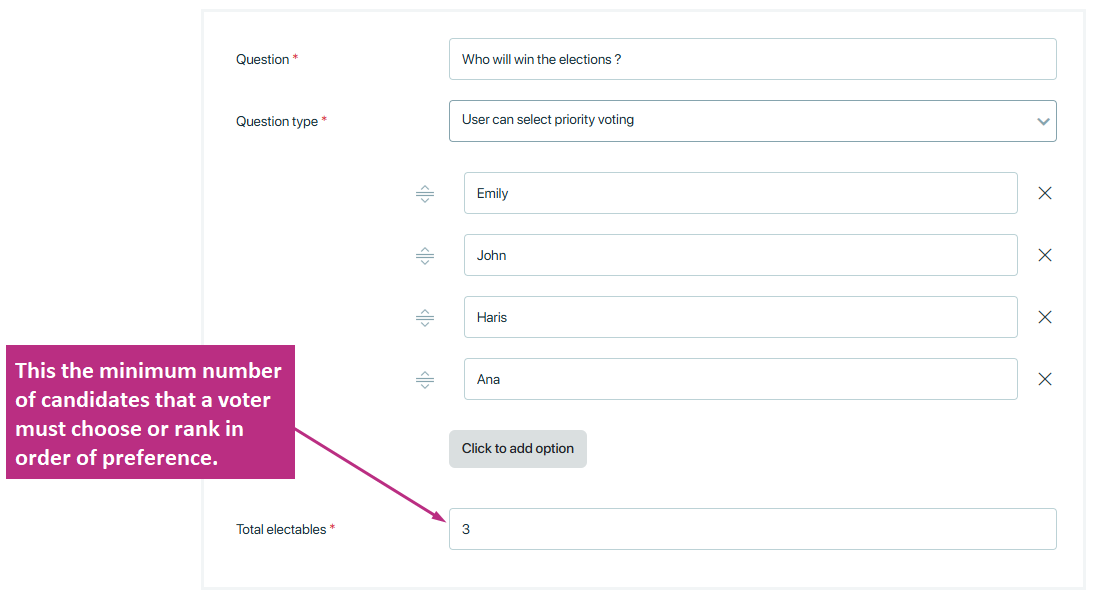
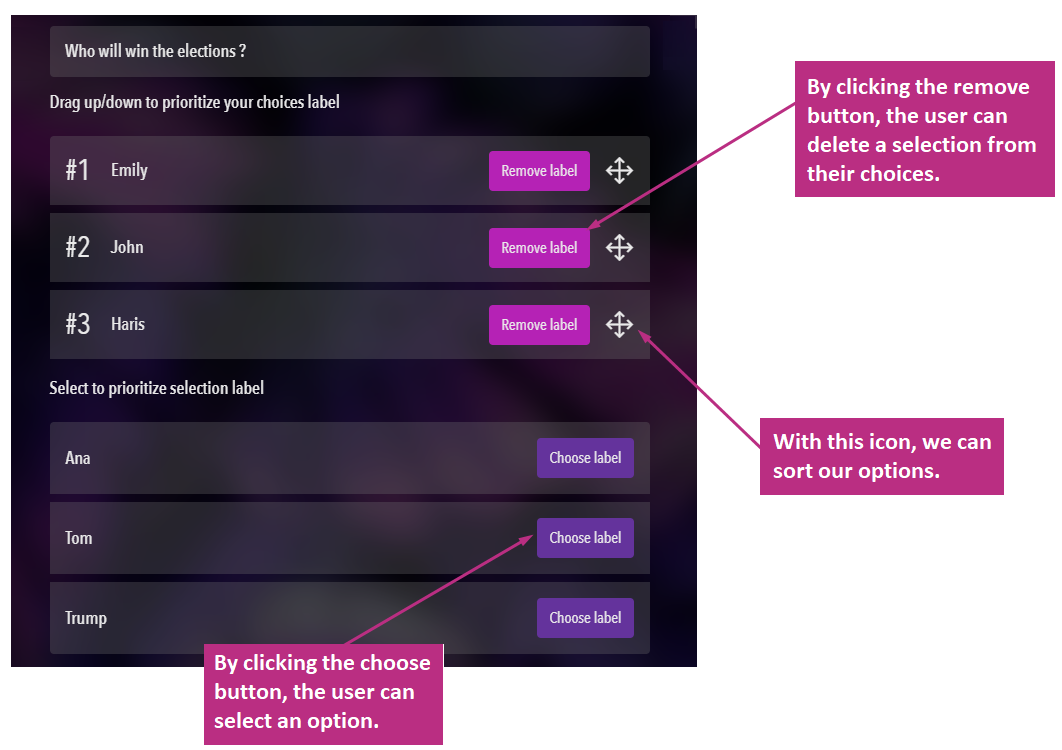
A priority question is a type of voting mechanism where participants rank multiple candidates or options in order of preference. Instead of selecting just one choice, voters assign a ranking to each candidate, with their most preferred choice marked as number 1, the second most preferred as number 2, and so on. The method ensures that candidates are selected in a way that reflects the voters’ preferences as accurately as possible, while also ensuring fairness and representation.
How a priority question works (Based on the prioritization method)
Voter Ranking
- Each voter orders the given candidates/options based on preference.
- The highest-priority candidate is assigned rank 1, the next rank 2, and so forth.
First-Choice Vote Count
- The votes are first sorted based on the number 1 rankings on each ballot.
- The total number of first-choice votes is counted for each candidate.
- A distribution number is calculated using the formula:
Distribution number = total number of valid votes/ total electable. - If a candidate receives at least as many first-choice votes as the distribution number, they are elected immediately.
Sequential Counting:
- Votes are counted in rounds, starting with 1st-choice votes.
- If no candidate reaches the distribution number in the first round, the counting proceeds to 2nd-choice votes, which are added to the 1st-choice votes, and so on, until all positions are filled.
Tie-Breaking Rule
- If two or more candidates receive the same total number of votes, the candidate with the most first-choice votes is selected.
Example – the prioritization method
At a representative assembly, four board members need to be elected from a total of six candidates. Out of 100 representatives, 80 attend the meeting and all cast valid votes.
The distribution number is calculated as:
Distribution number = total number of valid votes/ total electable.
= 80 / 4
= 20
First-choice vote count:
| Candidate | A | B | C | D | E | F | Total |
| 1st vote | 25 | 22 | 16 | 8 | 6 | 3 | 80 |
Candidates A and B are elected in the first round with 25 and 22 first-choice votes, respectively.
Second-choice vote count:
| Candidate | A | B | C | D | E | F | Total |
| 2nd vote | 20 | 19 | 3 | 26 | 8 | 4 | 80 |
| 1st votes | 25 | 22 | 16 | 8 | 6 | 3 | 80 |
| Total | 45 | 41 | 19 | 34 | 14 | 7 | 160 |
Candidate D is elected in the second round with 34 votes.
Third-choice vote count:
| Candidate | A | B | C | D | E | F | Total |
| 3rd vote | 12 | 14 | 15 | 16 | 20 | 3 | 80 |
| 2nd vote | 20 | 19 | 3 | 26 | 8 | 4 | 80 |
| 1st votes | 25 | 22 | 16 | 8 | 6 | 3 | 80 |
| Total | 57 | 55 | 34 | 50 | 34 | 10 | 240 |
Candidates C and E have the same total number of votes, both exceeding the distribution number. Since only one board seat remains, C is elected because they received more first-choice votes (16 vs. 6).
Conclusion:
Candidates A, B, C, and D are elected to the board.
Impact on web app
Validation and other checks:
- Required Question: When a question is marked as “Required,” respondents must answer it before they can submit the survey or poll.
- Enable Comments: This setting allows respondents to add comments or additional feedback beyond the predefined answer choices.
- Anonymous: When a survey or poll is set to be “Anonymous,” respondents’ identities are not collected or recorded.
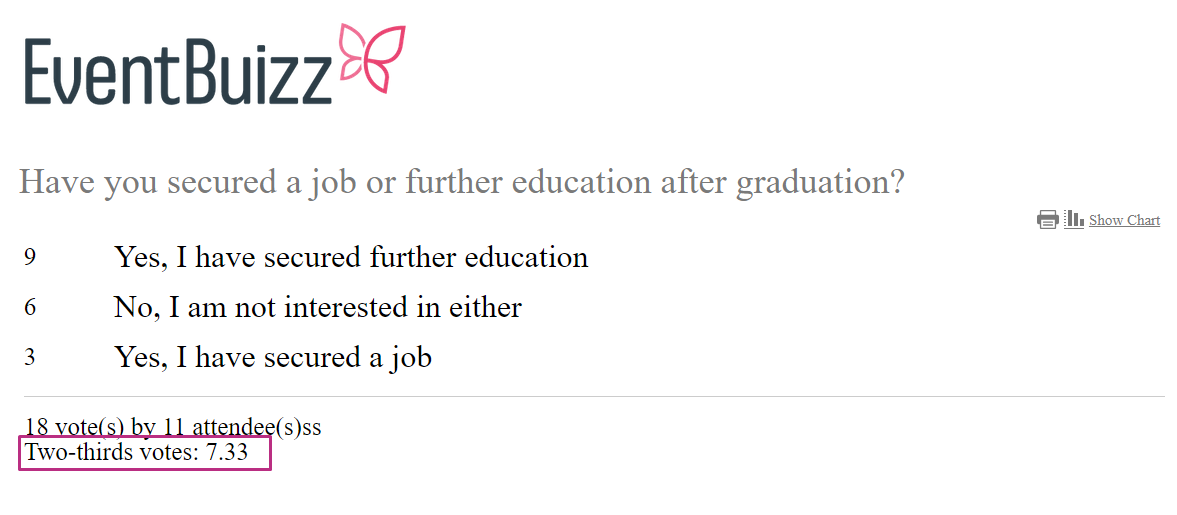
- Show 2/3 Majority: This setting indicates that the results will highlight when a response option receives a 2/3 majority of the votes. Useful for decision-making processes where a strong consensus is needed. It helps to easily identify if a significant majority of respondents agree on a particular option. This 2/3 majority only show in projector screen
- Results Chart Type: This refers to the type of chart used to display the results of the survey or poll. It includes pie chart, horizontal bar chart, progress bar chart, vertical bar chart.

Important: If 2/3 majority of the question is ON. It helps to easily identify if a significant majority of respondents agree on a particular option. This 2/3 majority only show in projector screen
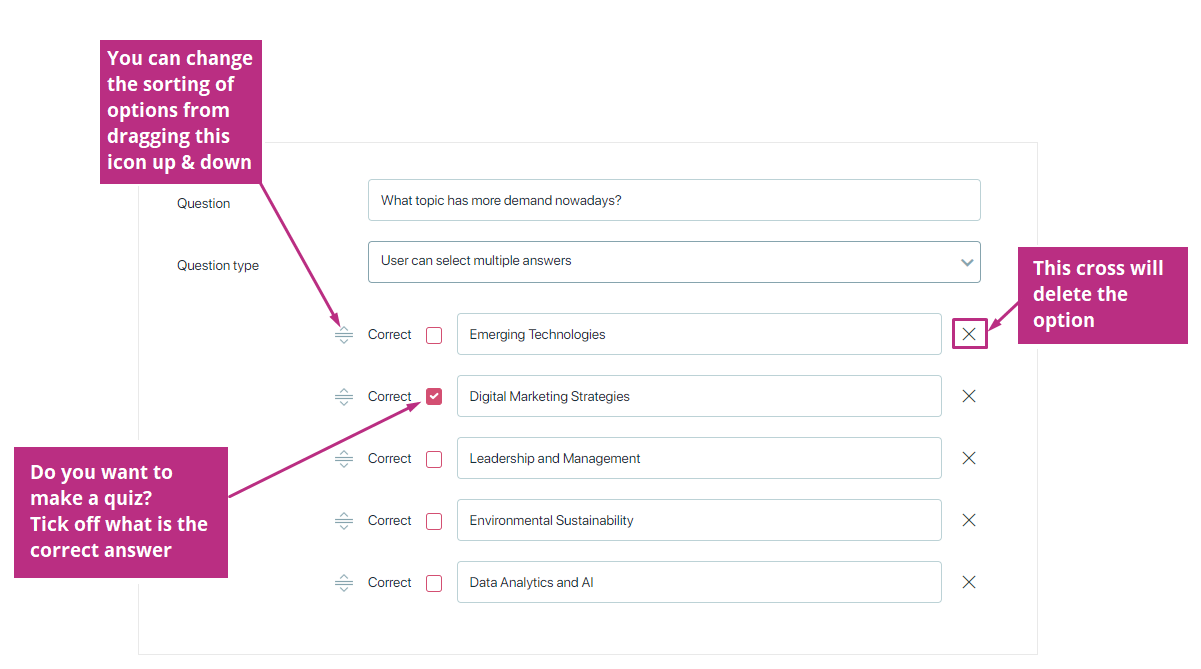
- Correct answer: If you like to create a quiz? Mark the option as correct answers.
- Click cross: It will delete the option.
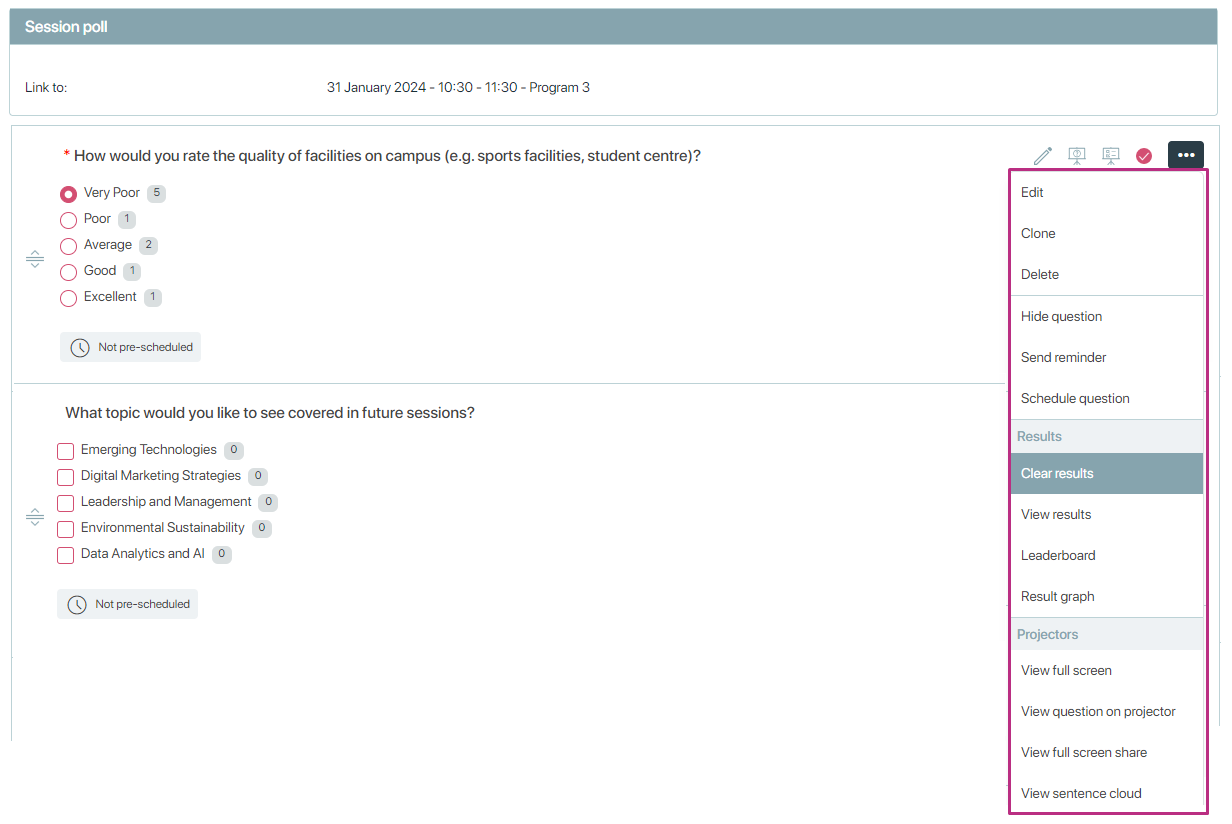
Click three dots icon ![]() to view many options.
to view many options.
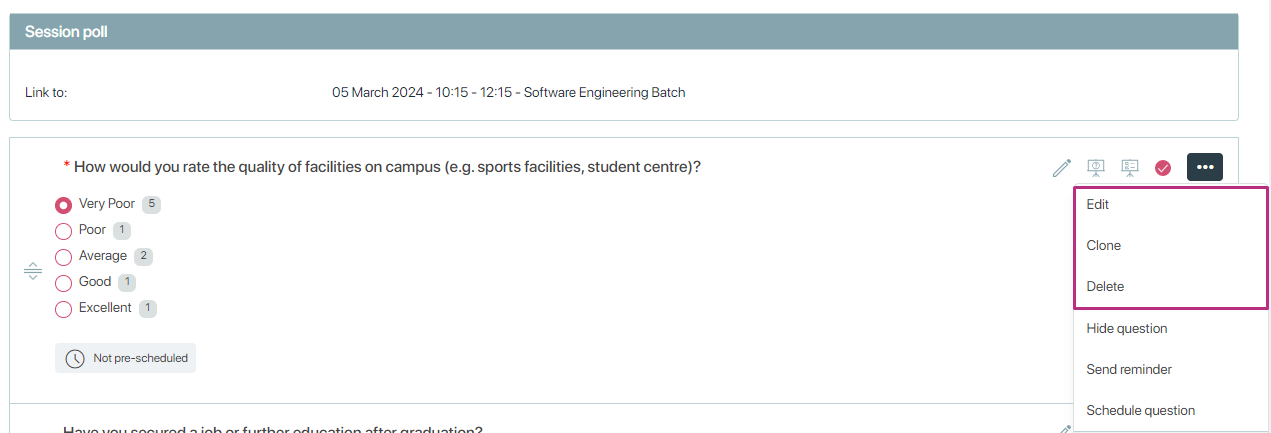
Edit, Clone and Delete
- Edit: This option allows you to modify the existing poll/ survey question. You can change the text of the question, adjust the available answer choices, or alter any settings related to the question.
- Clone: This option creates a copy of the existing poll/ survey question. It is helpful when you want to create a similar question without starting from scratch. You can clone the question and then make slight adjustments to the copy as needed, saving time and effort.
- Delete: This option removes the poll question from the survey or poll.
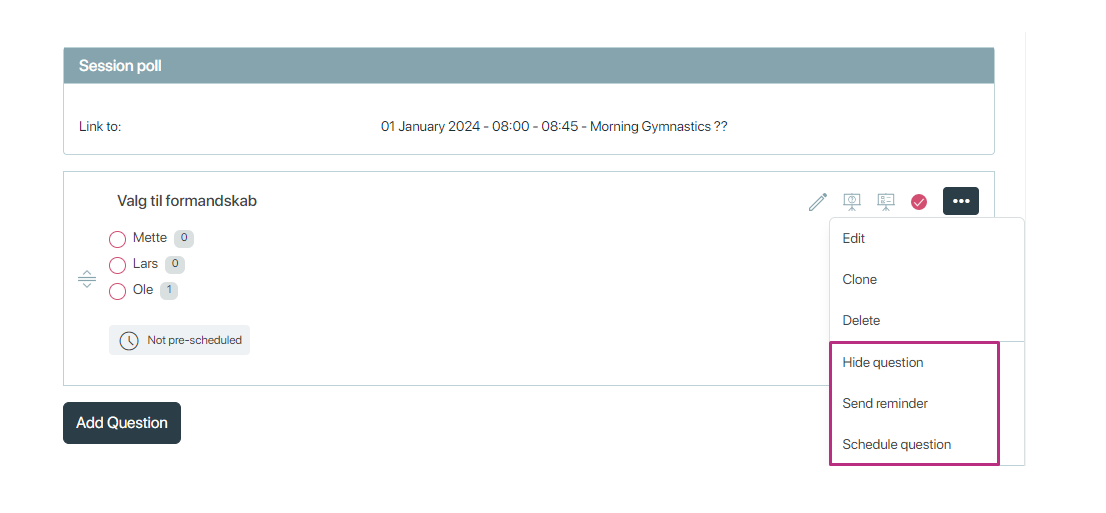
Hide and Schedule question
- Hide question: This option allows you to temporarily make a poll question invisible to respondents. Question will not be visible in web app.
- Schedule question: Set date and time for when the question should be visible for attendees.

Results Screens
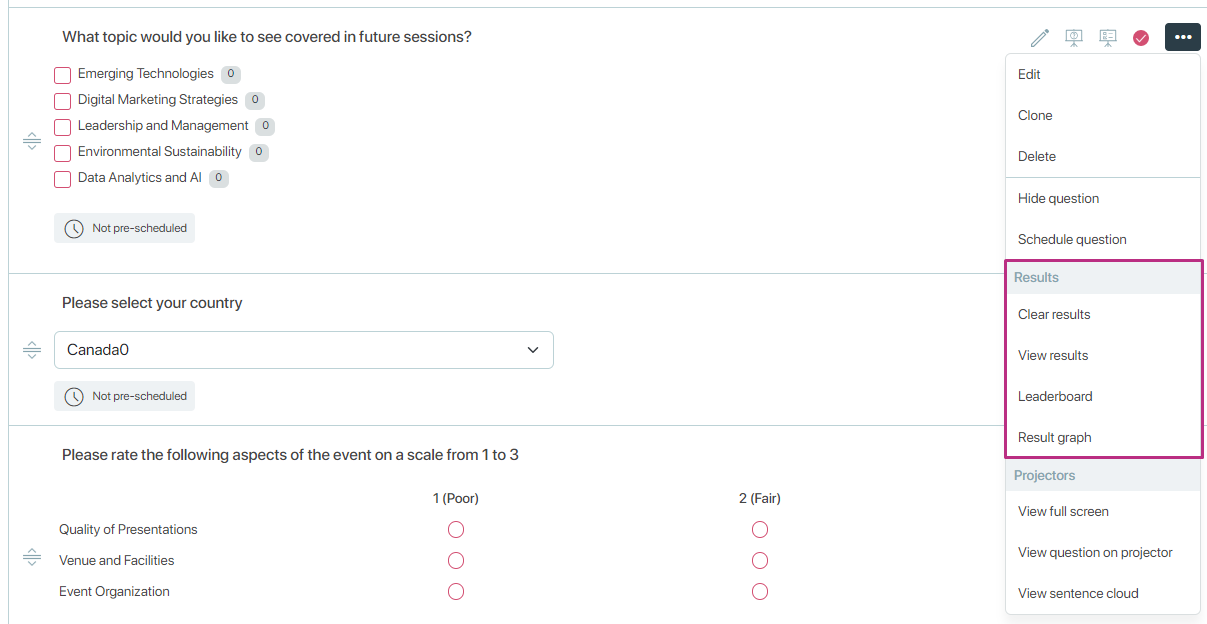
- Clear results: Clear the answers submitted by attendees.
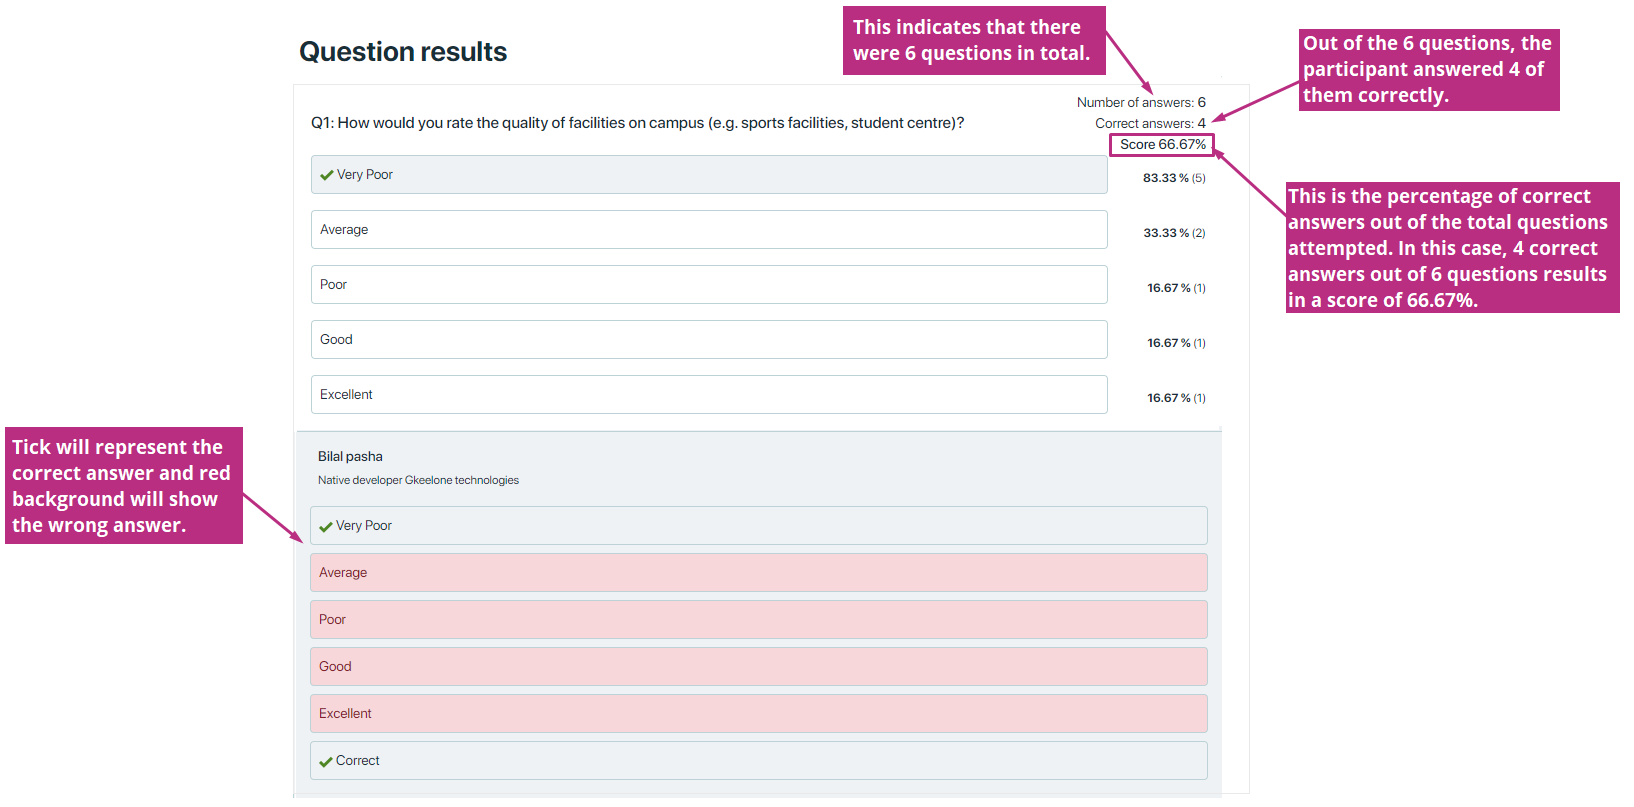
- View results: It likely allows the organizer to see the collected data of a particular question conducted during an event.
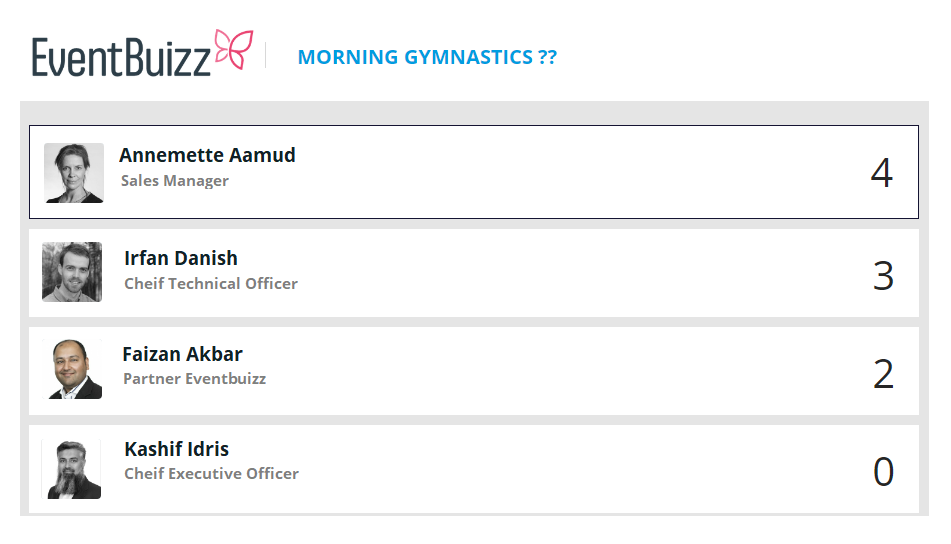
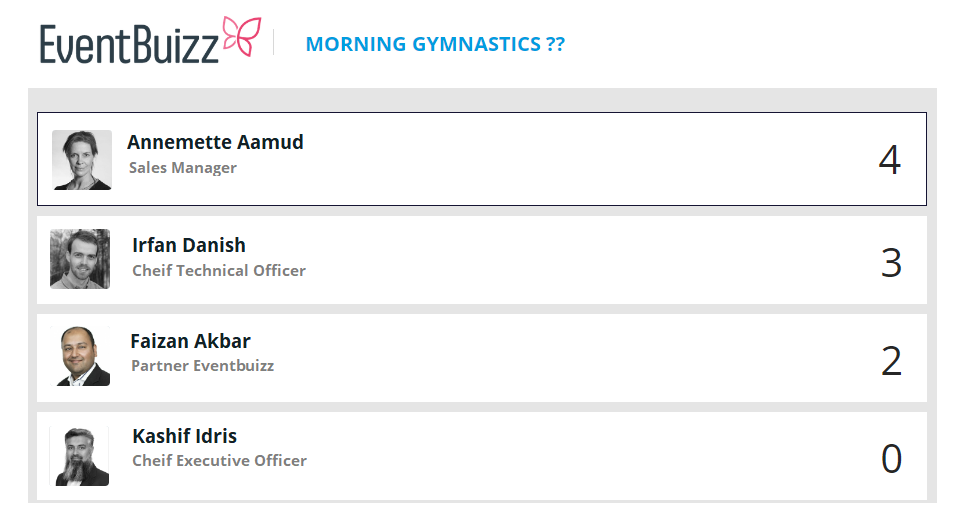
- Leaderboard: The “leaderboard projector” in polls/surveys typically refers to a feature that displays the current standings or rankings of participants on a projector screen. It shows the top performers or contributors based on their responses to the polls or surveys. This visual representation often encourages participation and adds an element of competition to the event, as attendees can see how they rank compared to others in real-time.
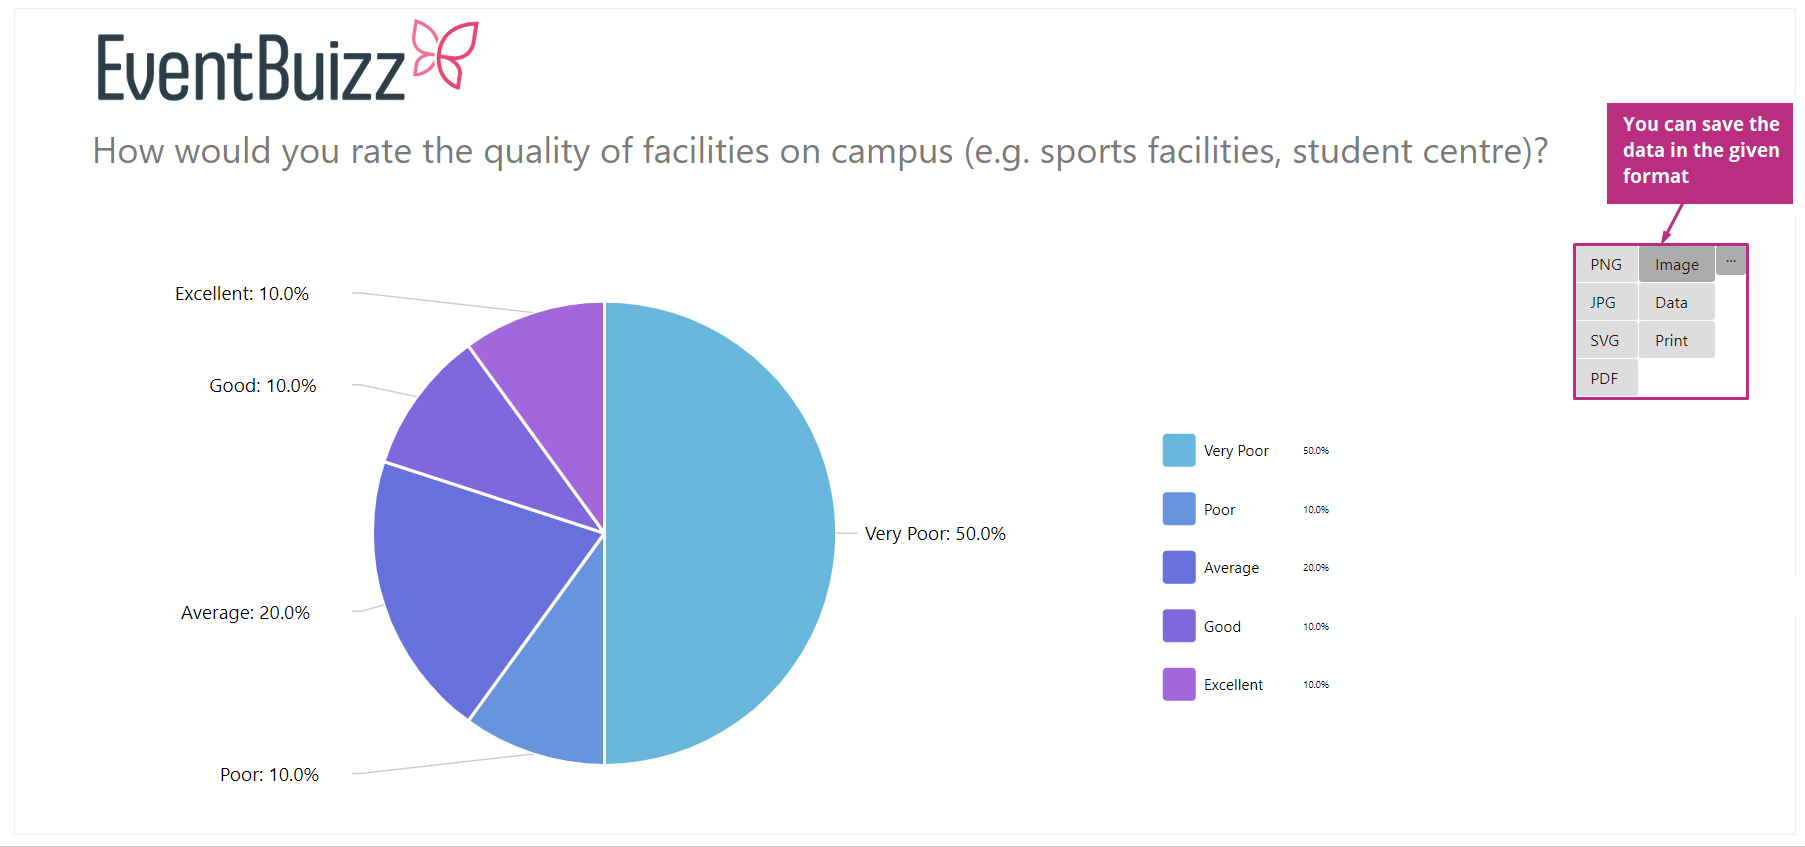
- Result graph: It probably refers to a graphical representation of the poll results, which can help users quickly grasp the trends and patterns within the data. Graphs such as bar charts, pie charts, horizontal bar chart, vertical bar chart, progress bar chart.
Projector Screens
There are four types of projectors:
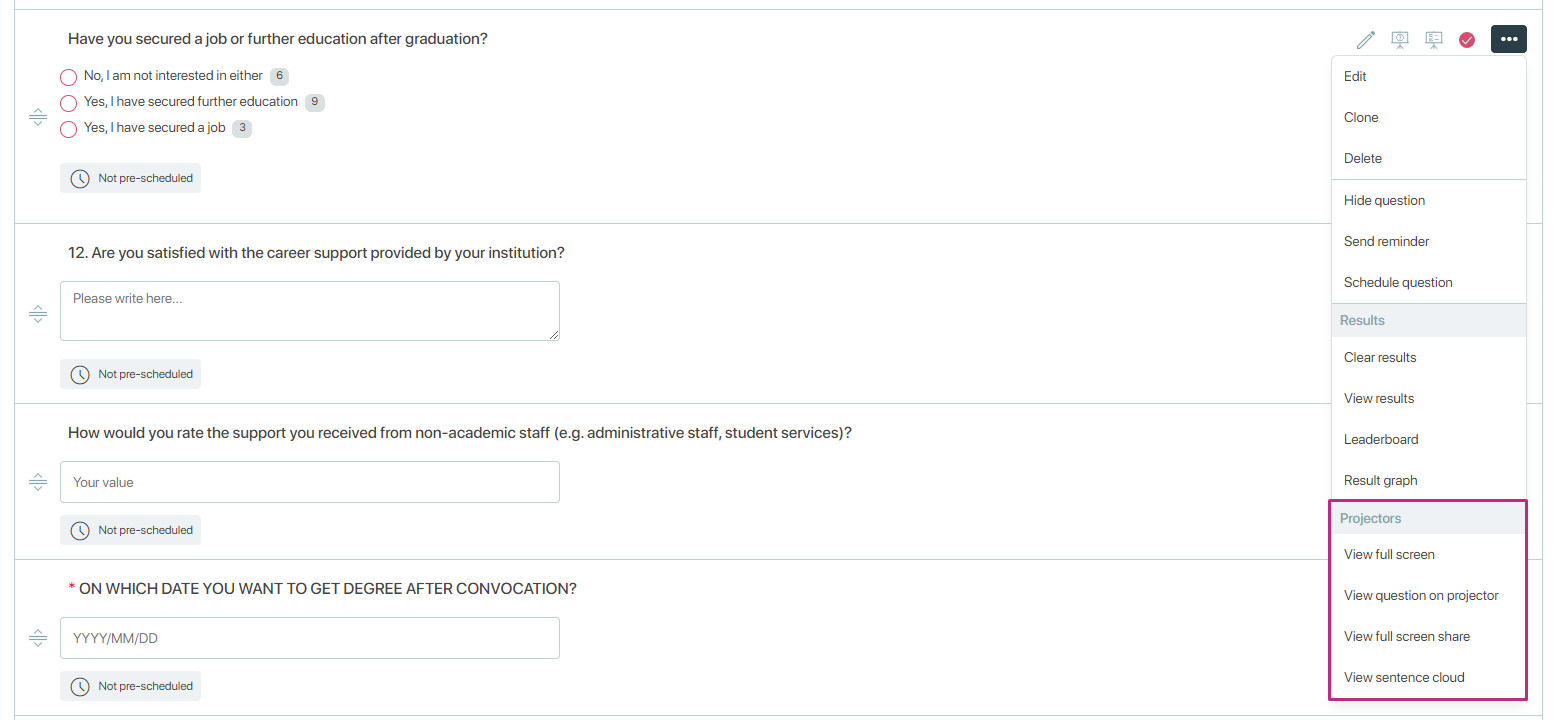
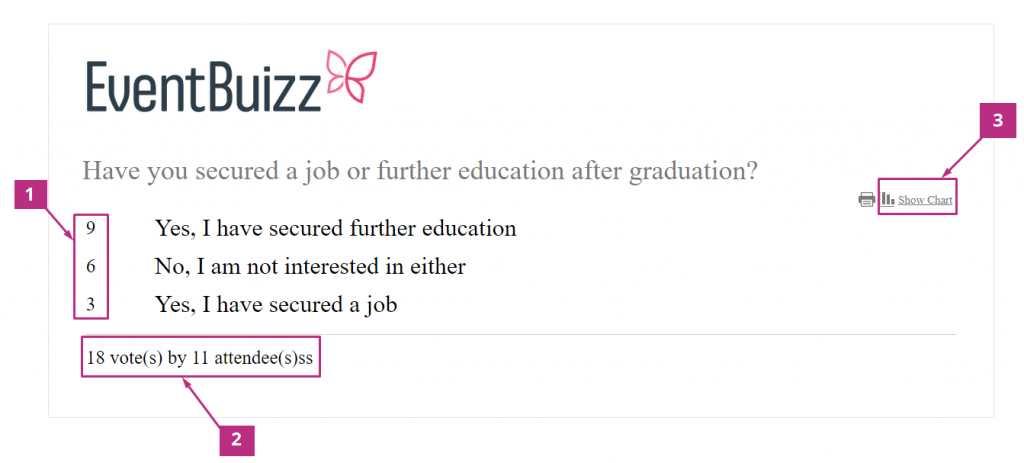
- View full screen: This allows the poll or survey results to be displayed in full-screen mode on a projector. This maximizes the visibility of the data, making it easier for a large audience to see the results clearly. This mode is ideal for presentations and events where you want to showcase the poll or survey results prominently to all attendees.
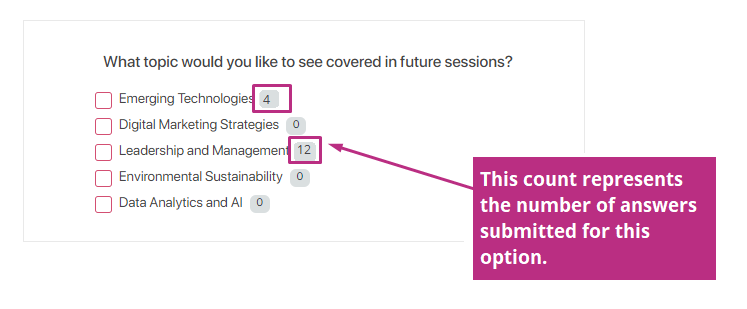
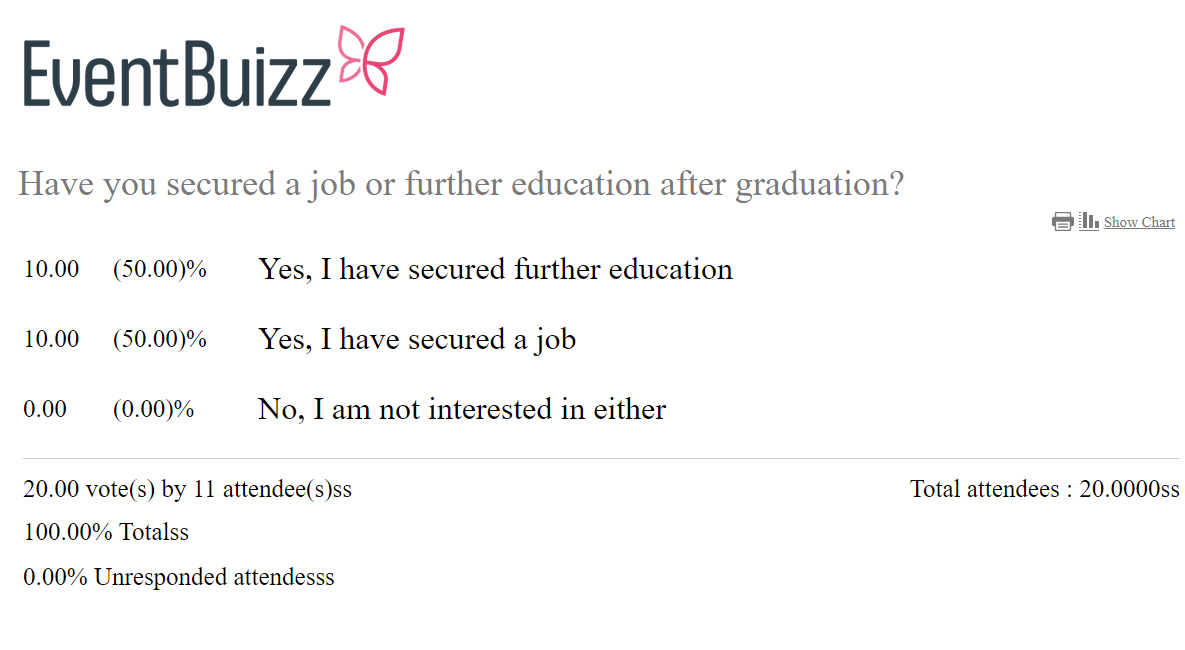
1- The numbering against each options shows the total number of attendees selected this answer.
2- 18 vote(s) by 11 attendee(s) show that 11 attendees has given 18 votes.
3- You can see the graph chart of particular question by clicking on the show graph for clear graphical representation
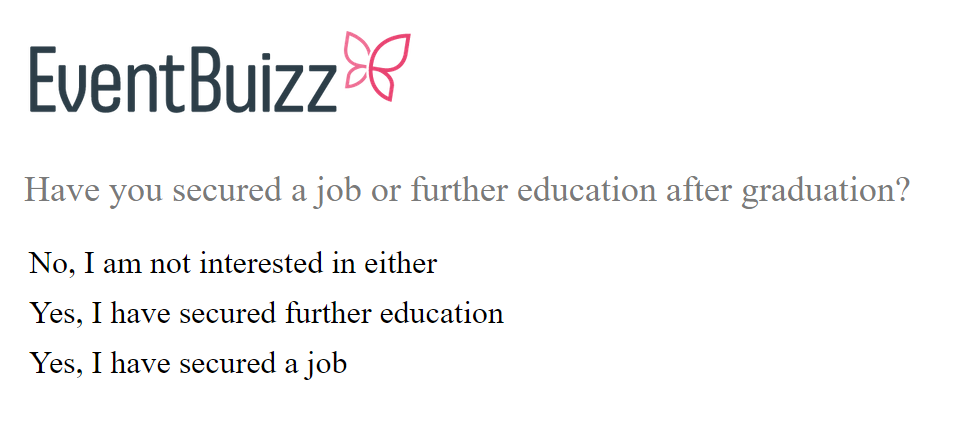
- View question on projector: It allows the poll or survey question to be displayed on a projector screen. This is useful for sharing the question with a larger audience during an event, making it visible to everyone in the room. Attendees can see the question on the big screen, which can facilitate participation and ensure everyone is aware of what is being asked.
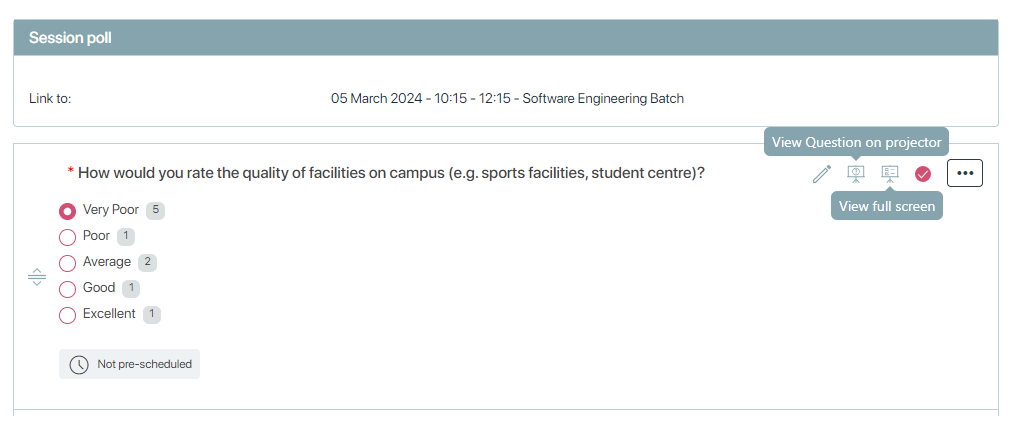
You can view the full screen and view full screen on projector by clicking on the icon in front of question
IMPORTANT NOTE: In the case of weighted voting, we cannot make the questions anonymous because we need the data to count the votes accurately.
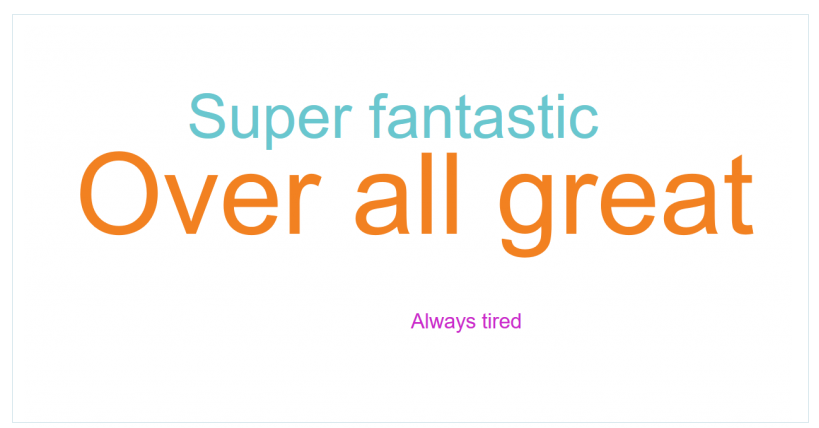
- View sentence cloud: The “View sentence cloud projector” in polls/surveys allows the display of a sentence cloud on a projector screen. A sentence cloud is similar to a word cloud, but instead of individual words, it highlights entire sentences or phrases that participants have submitted. The response your attendees choose the most, will be in bigger letters.
For adjusting settings – font colors and size, please see the Settings -> Tag cloud settings
NOTE: You can set up Sentence cloud in both polls and surveys – using the ‘single answer’, ‘multiple answer’ or ‘dropdown’.
Tools
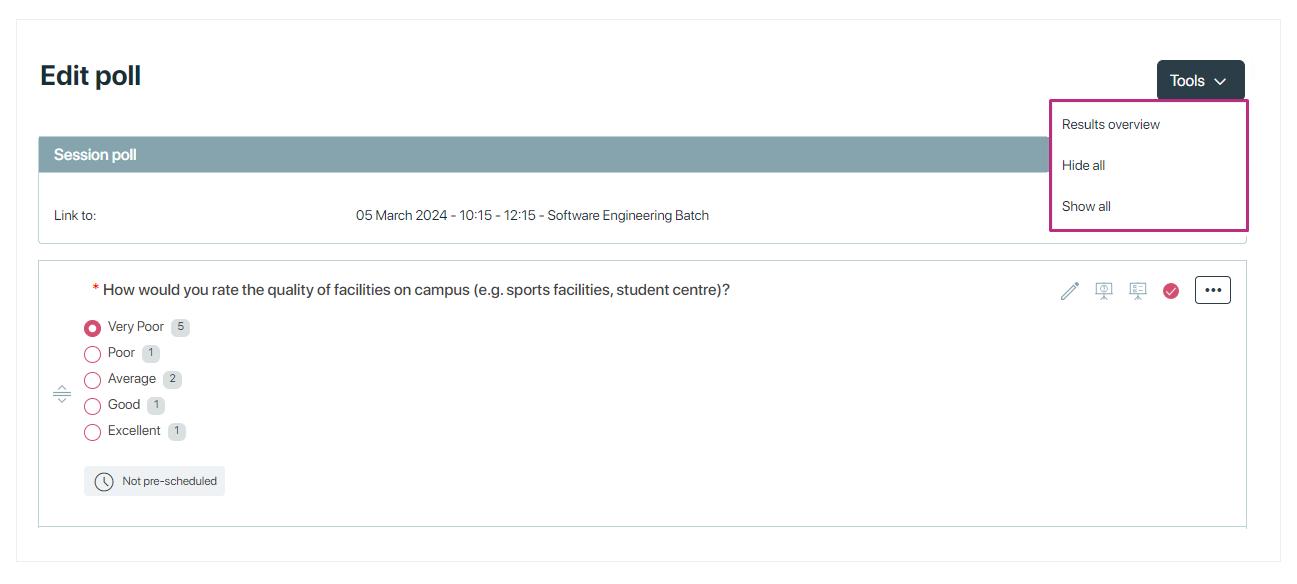
- Hide all: This option would hide all the poll questions or options currently displayed.
- Show all: This option would expand or reveal all the poll/ survey questions or options that have been hidden. This ensures that all the questions and options are visible to the user, allowing them to review and interact with all parts of the poll/ survey.
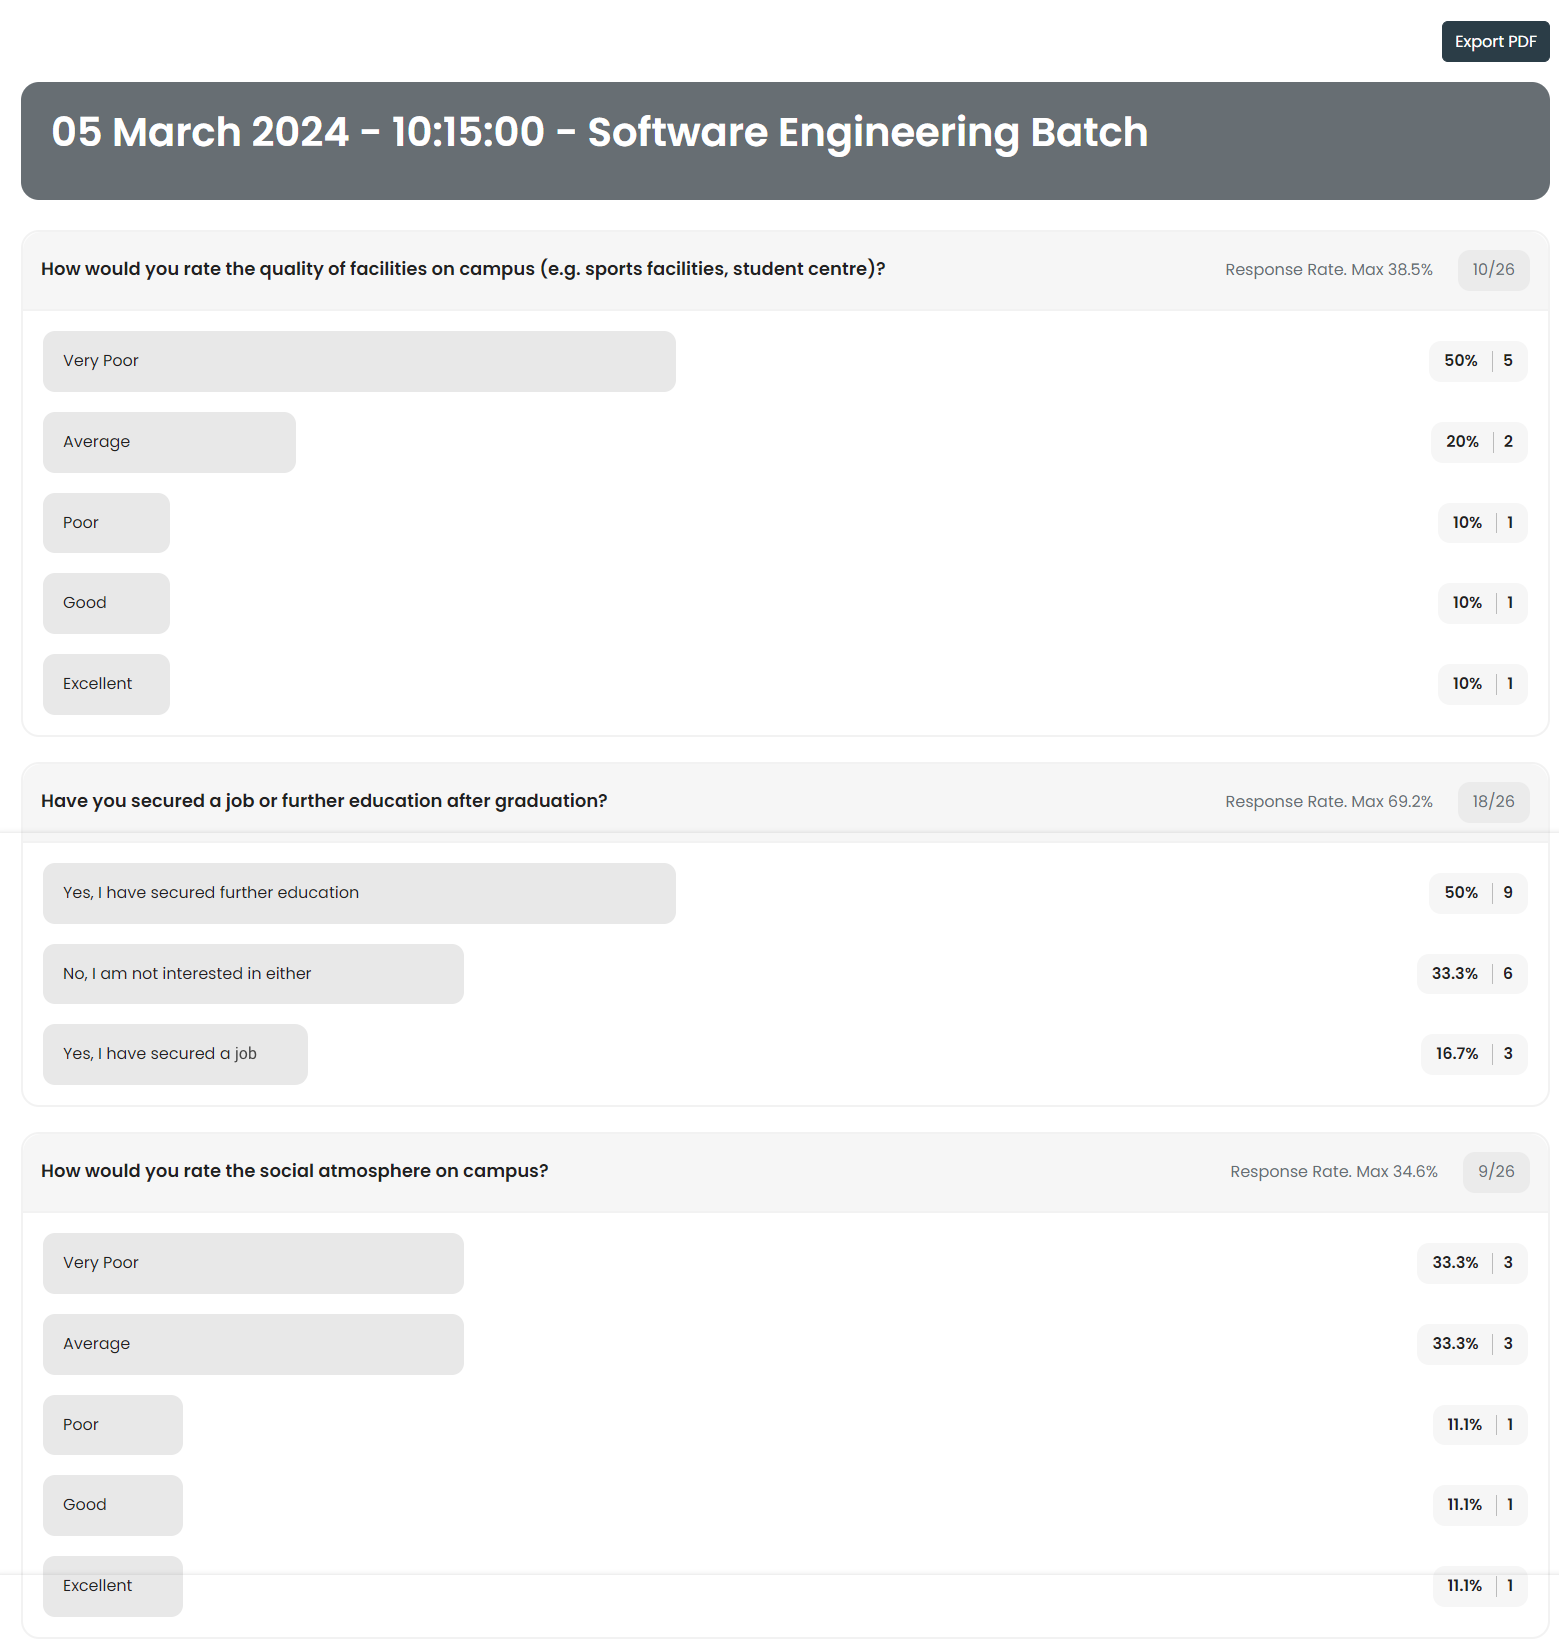
- Result Overview: This feature is a crucial tool for organizers to analyze the data collected from their polls or surveys efficiently and effectively.
Polls/surveylisting
Polls and Survey Listing
Once polls and surveys are added, they start to appear on this screen. To perform any action on a poll or survey, click on the three dots icon ![]()
Edit, In-active and Delete
- Edit: This option allows you to modify the existing poll/ survey question. You can change the text of the question, adjust the available answer choices, or alter any settings related to the question.
- In-active: The “Active” status for polls or surveys indicates that they are currently live and available for participants to respond to. Disabling typically hides or removes the poll or survey from the user’s active polls/surveys list, but it does not permanently delete it.
- Delete: This option removes the poll/ survey question from the survey or poll.
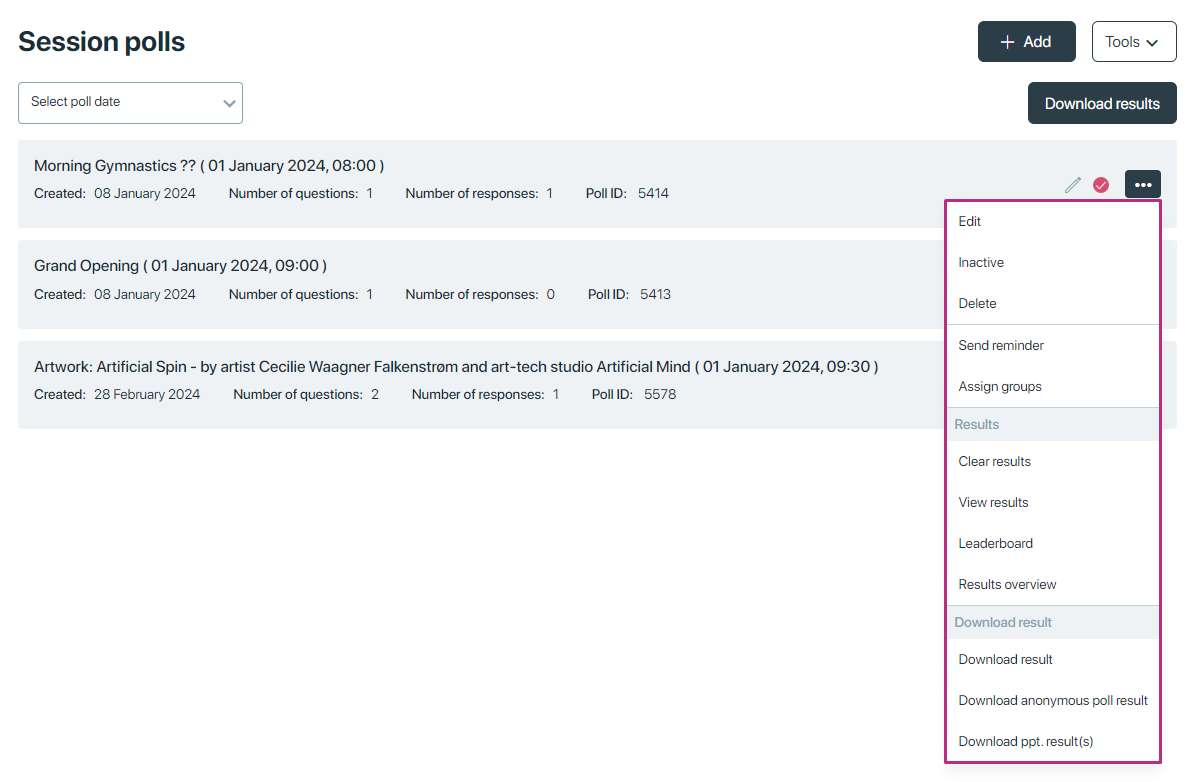
Send remainder, Schedule form and Assign group
- Schedule form:
– This feature allows you to set a specific time and date for the entire survey form to become available to respondents.
– Applies to the entire survey form, making the whole survey available or unavailable based on the set schedule.
– Used when you want to control the availability of the entire survey in one go.
NOTE: You can schedule questions in both polls and surveys for different timings. However, if you want to schedule the entire form to be available at the same time, you can do this for survey forms only. You can schedule the survey form as a whole at once. This functionality is not available for polls.
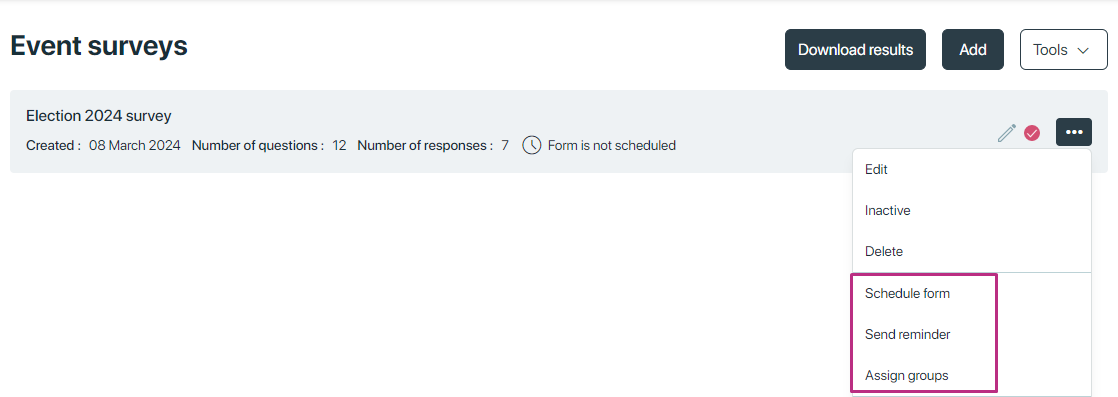
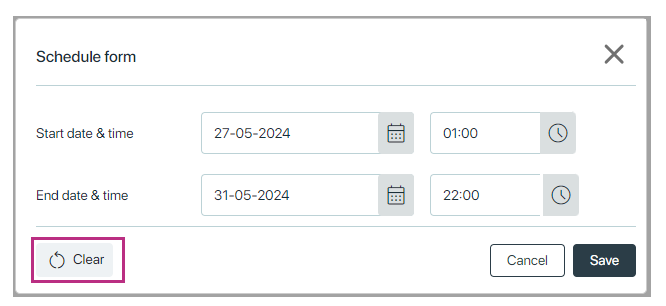
You can clear scheduling date and time by clicking on the clear button.
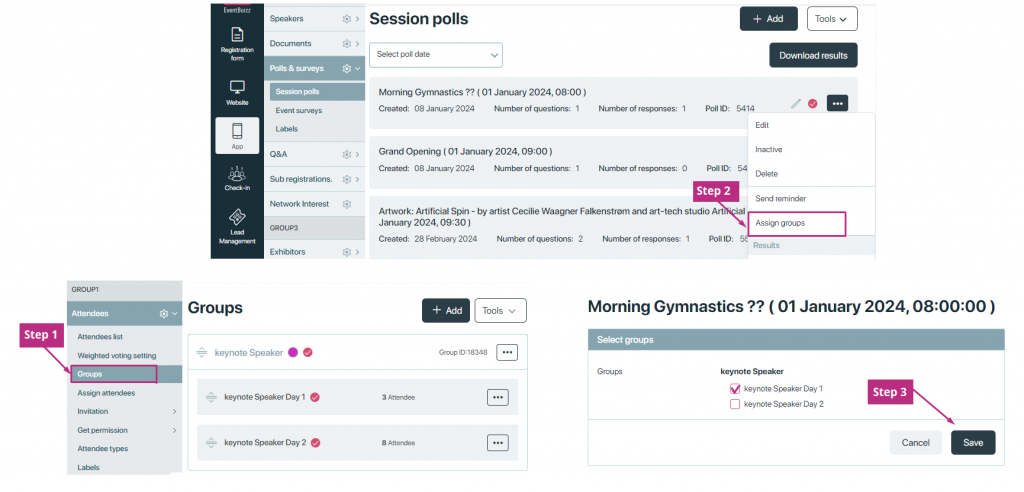
Assign Groups
The “Assign Groups” feature in polls or surveys allows you to designate specific groups of participants who will be able to see and respond to a particular poll or survey. To target specific segments of participants for a poll or survey, ensuring that only the intended audience can access it.
-
-
- Step 1: You can create groups based on various criteria, such as department, role, location, or any other relevant category. Click here to see how groups are created.
- Step 2: Once groups are created, you can assign a poll or survey to one or more of these groups.
- Step 3: Click save button
-
- General Distribution: Polls or surveys are available to all participants without any restrictions.
- Assign Groups: Polls or surveys are only accessible to the selected groups, allowing for more focused and relevant data collection.
Send Remainder
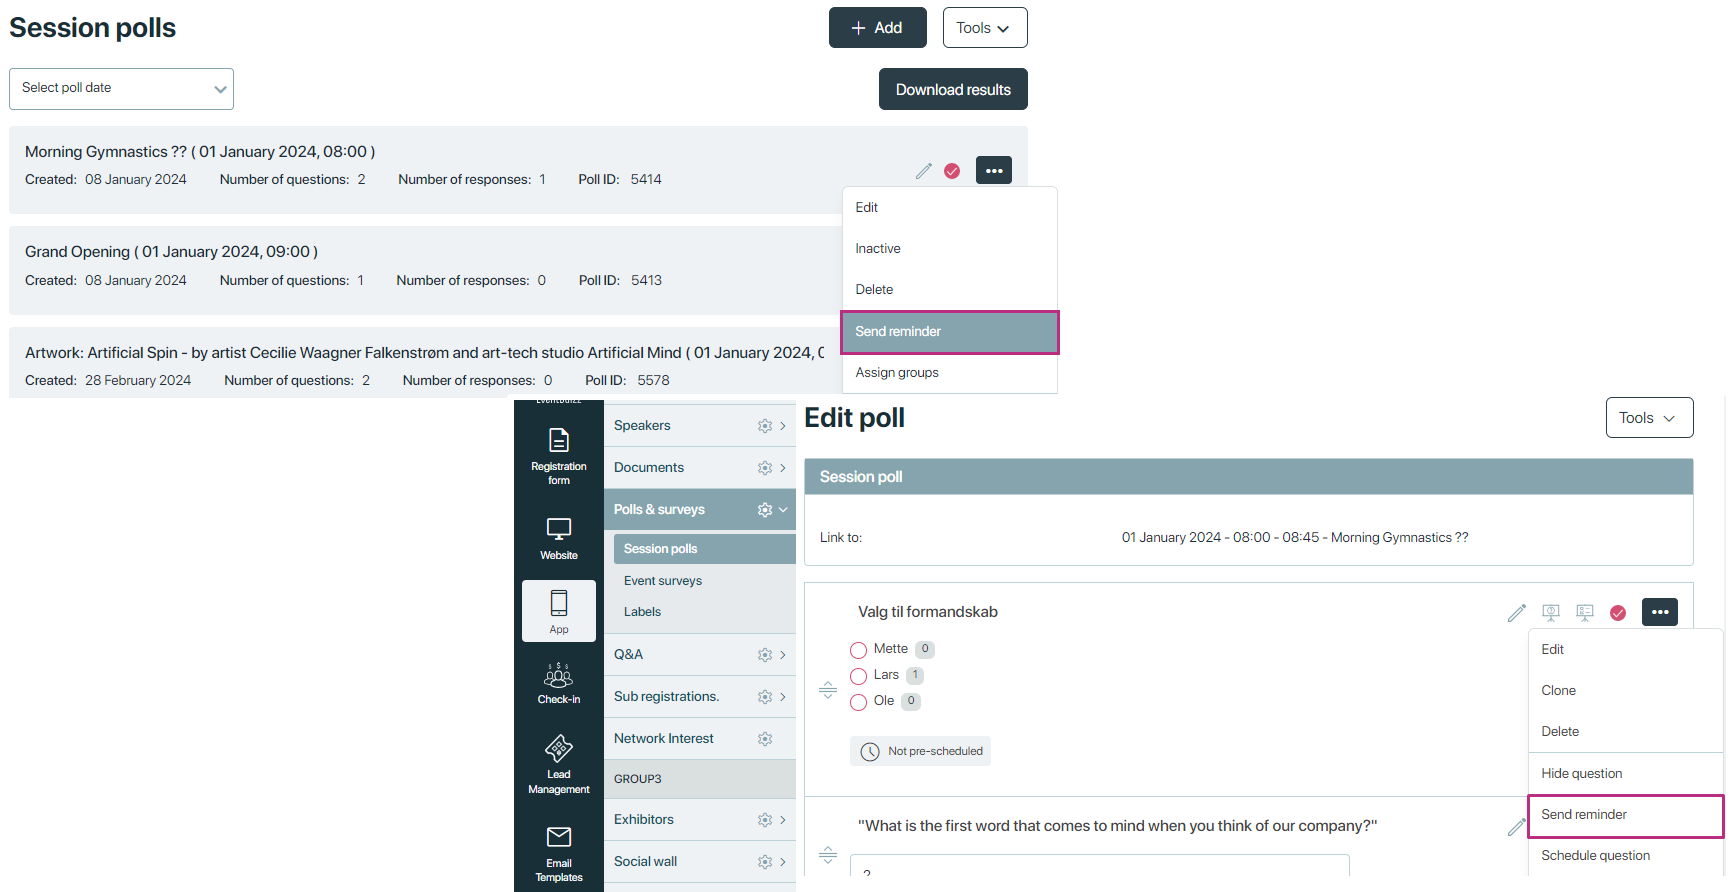
The “Send Reminder” setting in polls/surveys in Eventbuizz allows organizers to send notifications to attendees reminding them to participate in a poll or survey. This feature helps increase participation rates by prompting attendees who may have missed or forgotten to respond. You can send remainder to attendees for complete poll/survey or just for a question.
Start by customizing the poll/ survey reminder email template. To make it easier for the attendees, you can insert a direct link to the survey. When clicking they will be directed to the survey, after logging on to the App.
You will find the link by logging on to the web app on your pc. Then go to Survey and insert the browser link, as shown below.
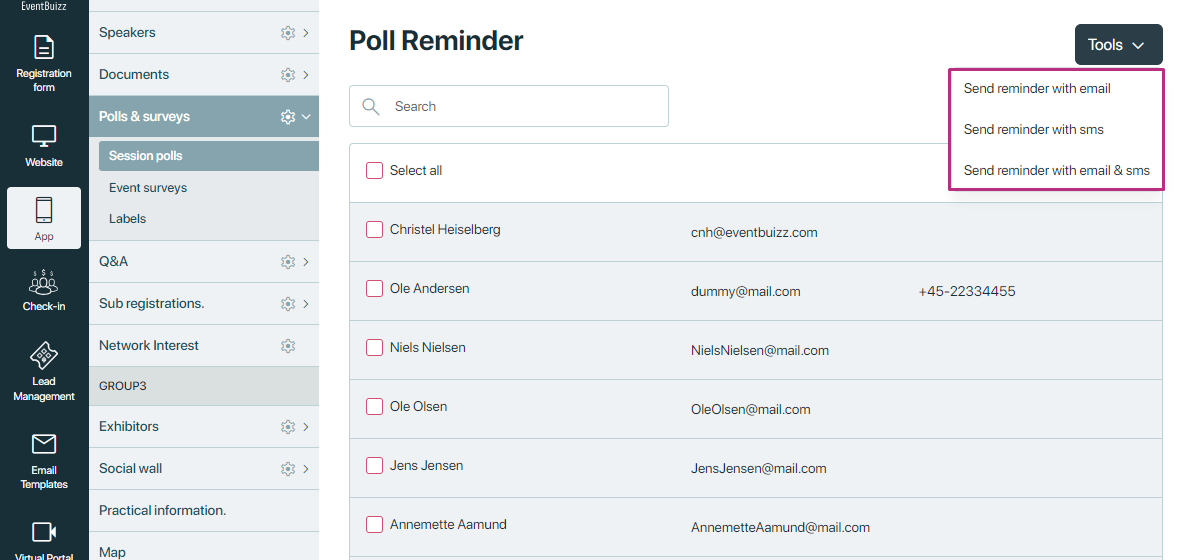
Select your attendees and send remainder. Reminders can be sent via email, SMS or both.
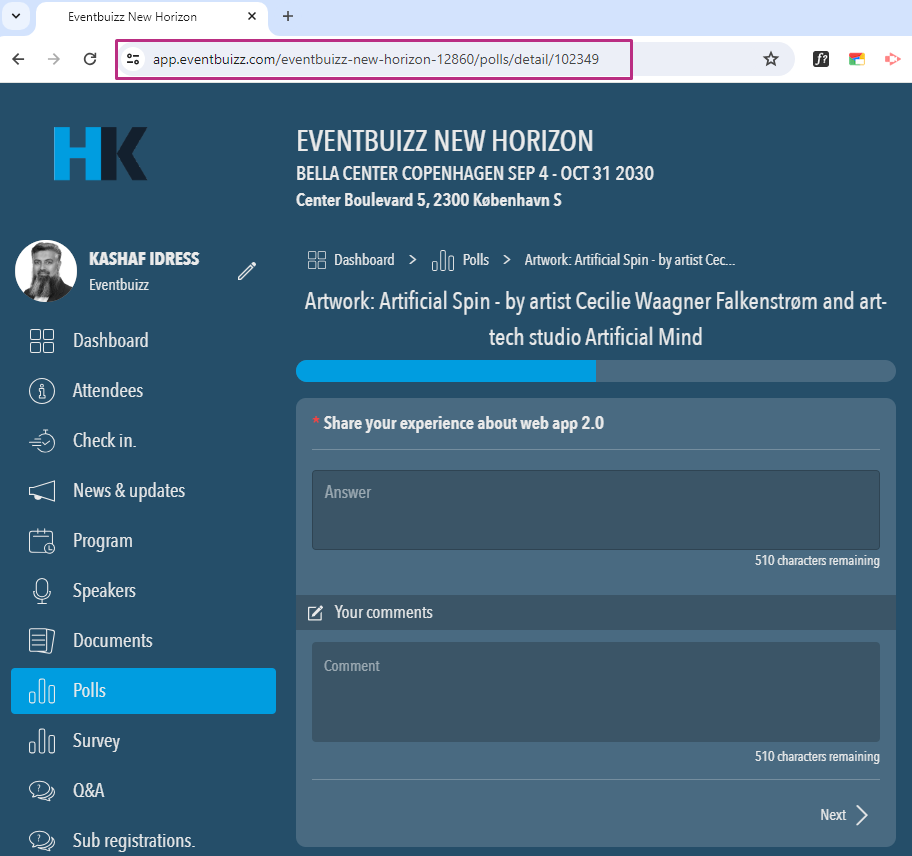
Insert the link to the template.
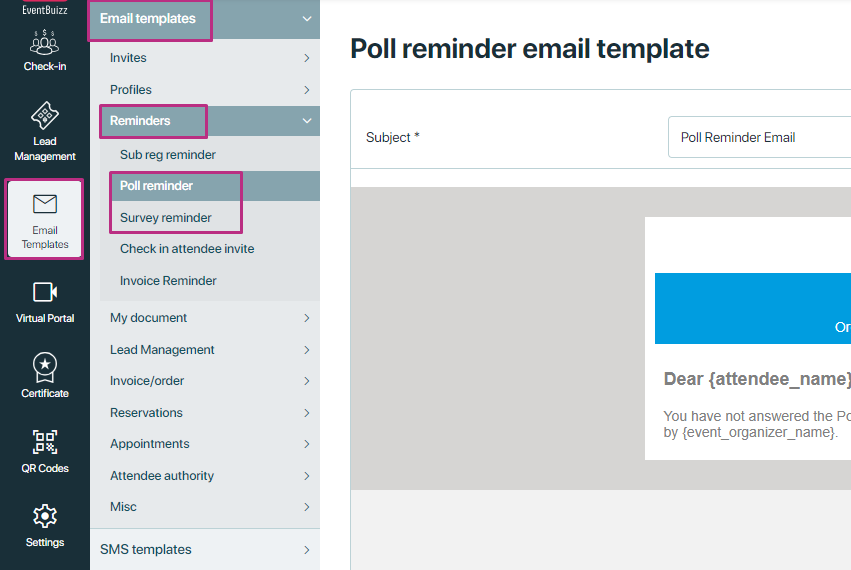
When the email template is done, you are ready to send out the actual survey reminder.
Results:
- Clear results: Clear the answers submitted by attendees.
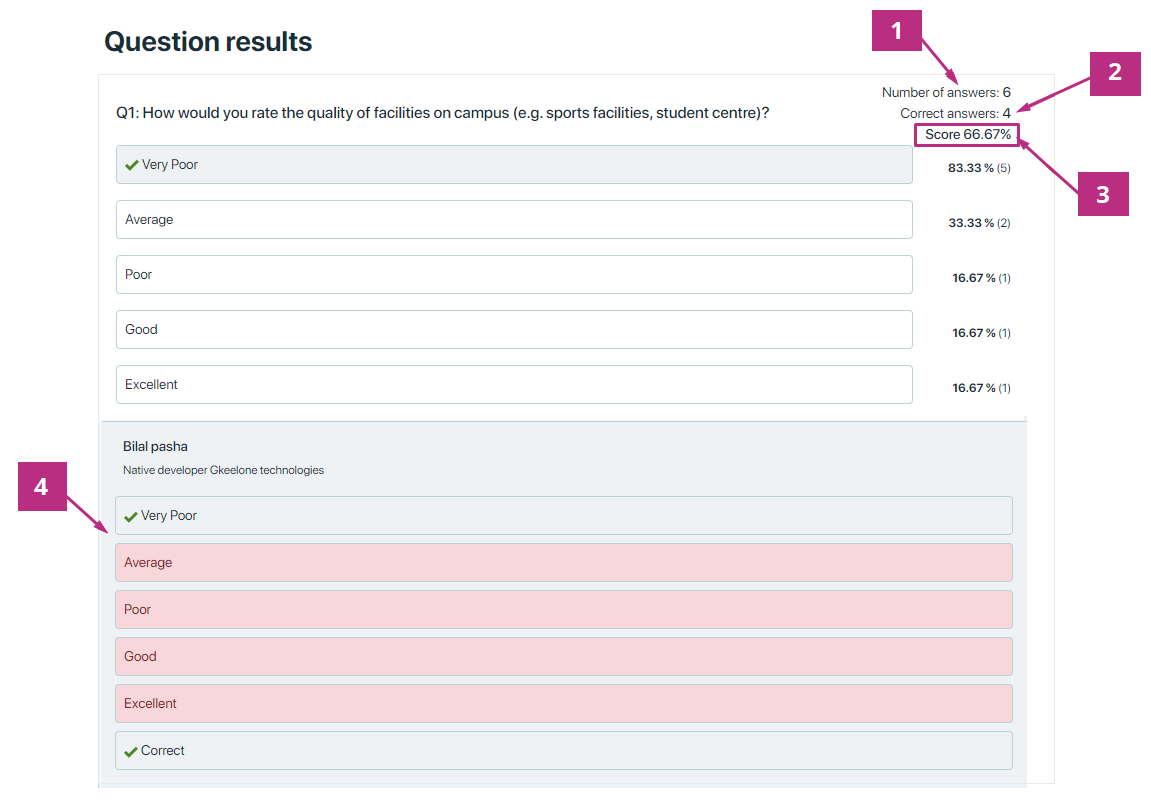
- View results: It likely allows the organizer to see the collected data of complete poll/ survey at one place conducted during an event. In screenshot, numbering indicates:
-
- “This indicates that there were 6 questions in total.”
- “Out of the 6 questions, the participant answered 4 of them correctly.”
- “This is the percentage of correct answers out of the total questions attempted. In this case, 4 correct answers out of 6 questions results in a score of 66.67%.”
- Tick will represent the correct answer and red background will show the wrong answer.”
-
- Leaderboard: The “leaderboard projector” in polls/surveys typically refers to a feature that displays the current standings or rankings of participants on a projector screen. It shows the top performers or contributors based on their responses to the polls or surveys. This visual representation often encourages participation and adds an element of competition to the event, as attendees can see how they rank compared to others in real-time.
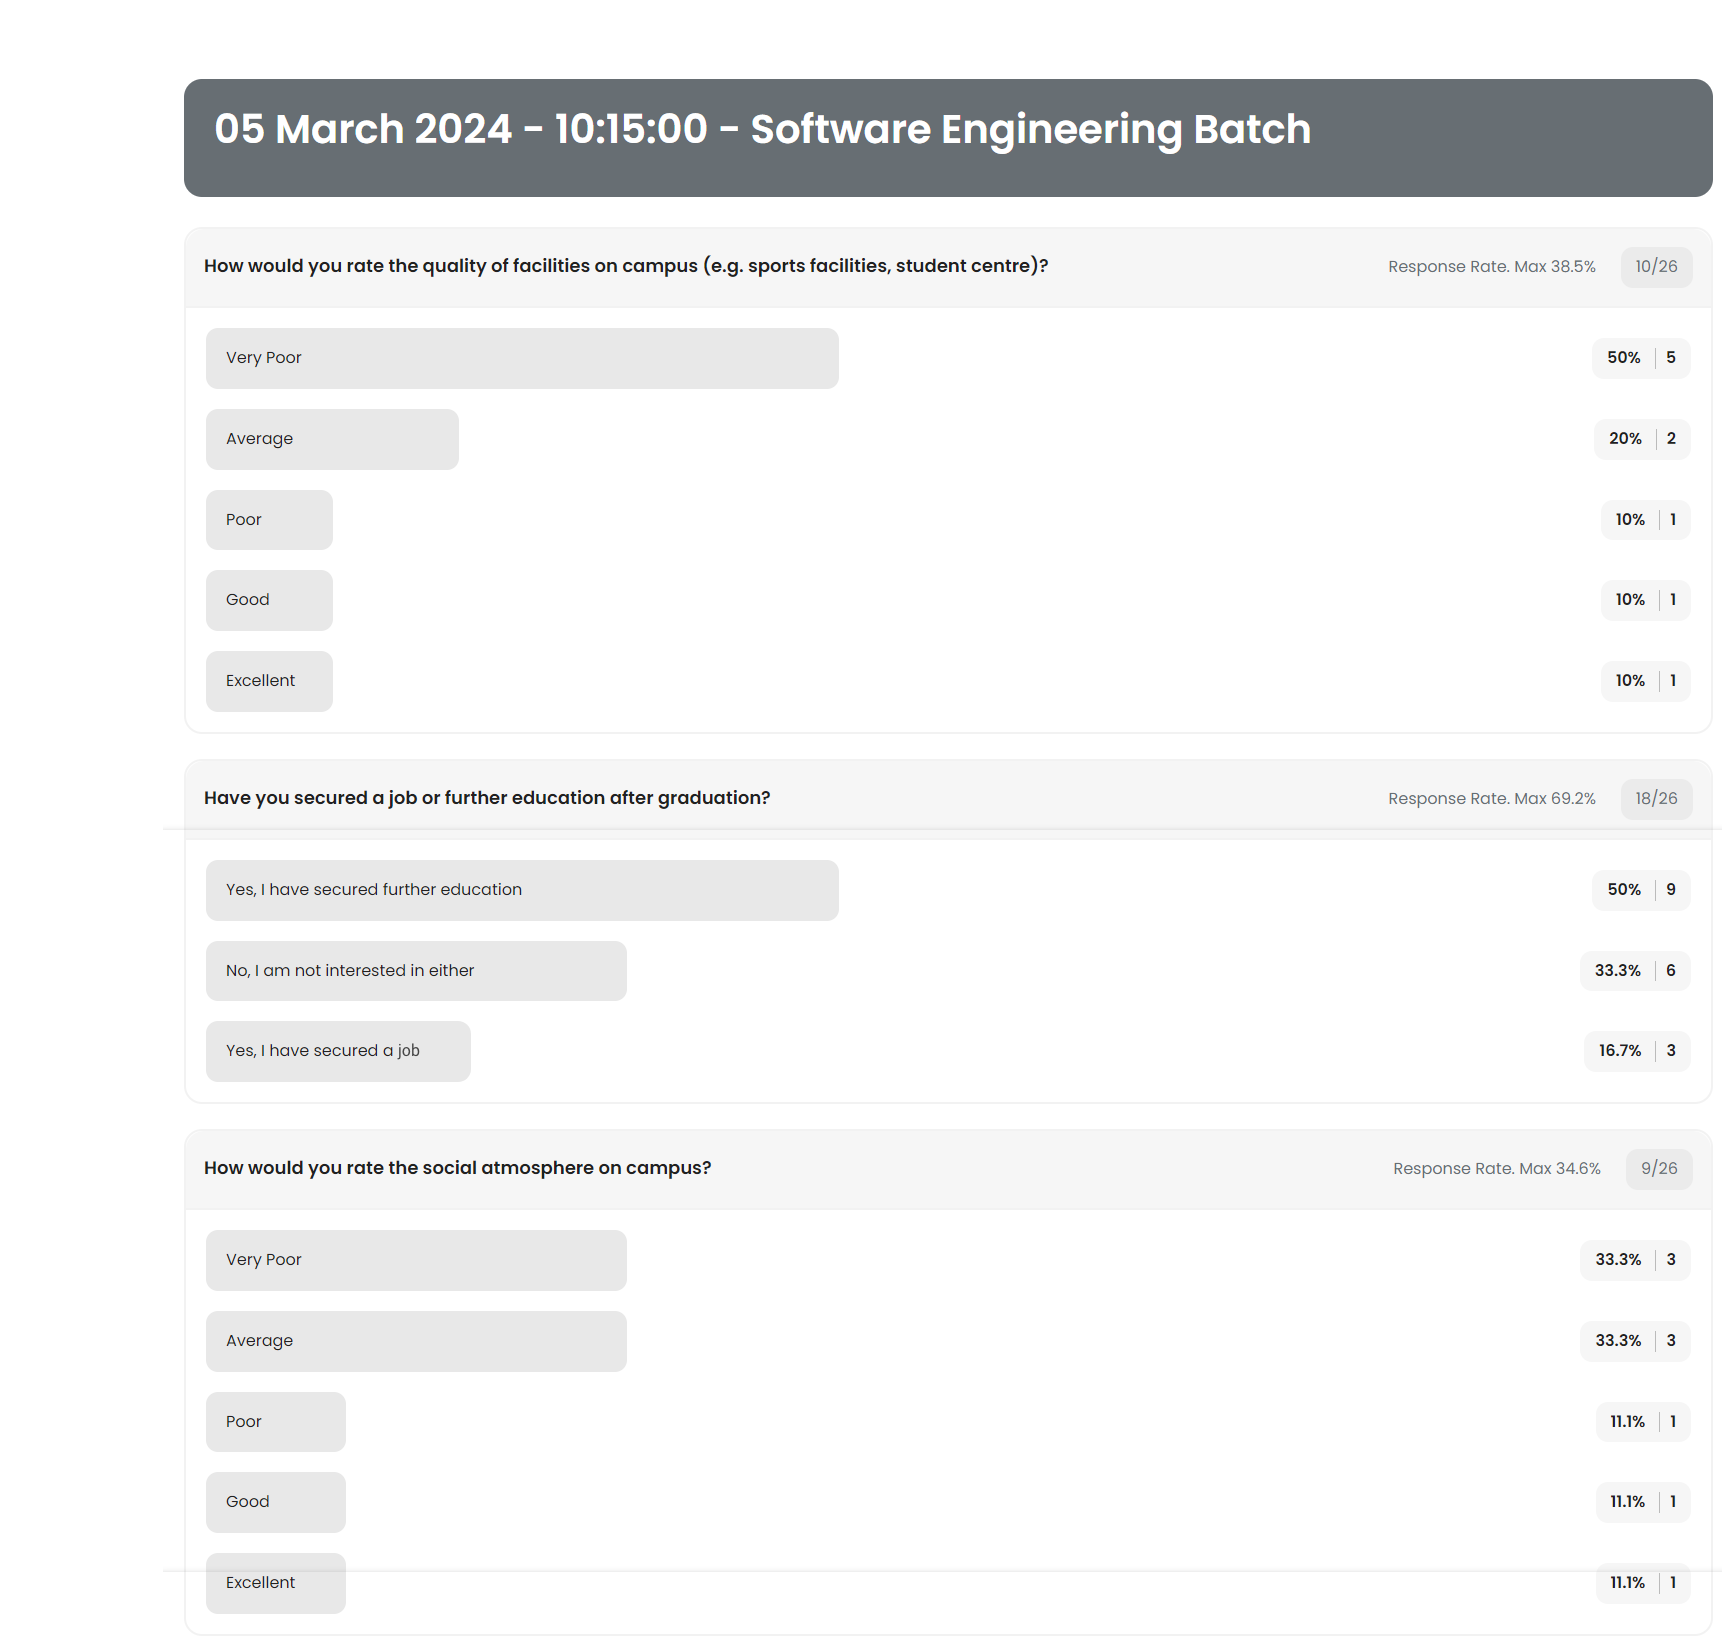
- Result overview: It shows aggregated data from all the respondents, allowing you to see overall trends and patterns in the responses. This might include percentages, counts, or other summary statistics.
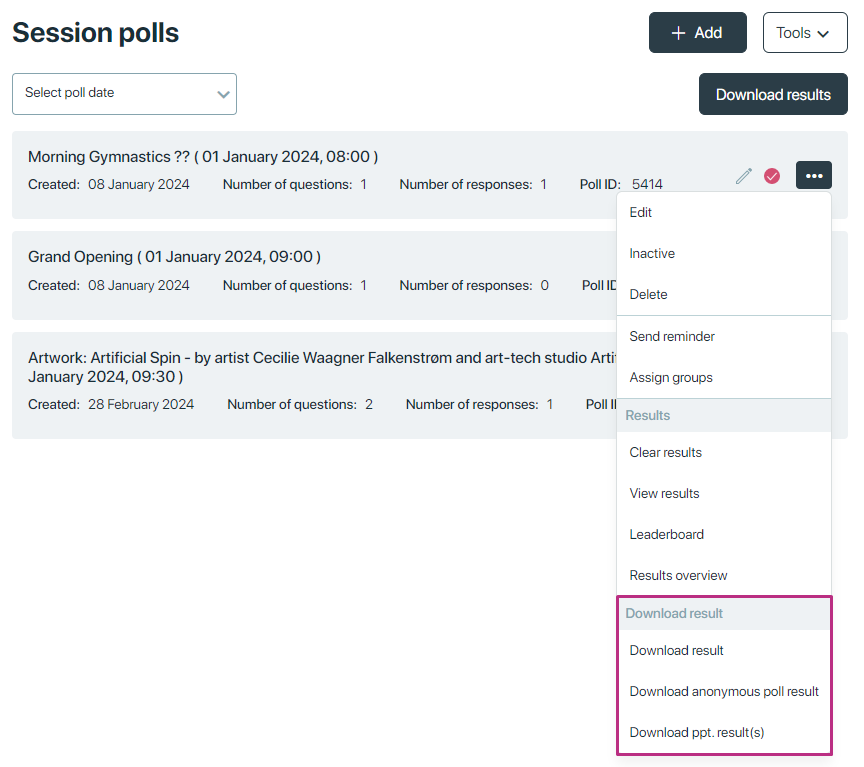
Download results:
- Download results: This option enables the download of all poll or survey results in a standard data format, such as CSV (Comma Separated Values) or Excel. This is useful for detailed data analysis and record-keeping.
- Download anonymous poll/ survey results: It will download the results of polls/ survey having anonymous questions.
- Download ppt .result(s): Download the polls or survey results in PowerPoint format (PPT). This can be particularly useful for presentations or reports where visual aids are necessary. The results are likely formatted in a way that’s easy to integrate into slides for sharing or presenting. Only three types of questions are exported in PPT file: single, multiple and dropdown.
Authority requests
Authority requests
Attendee authority request – Brief description
Overview
The Attendee authority sub-module within the Poll and Surveys module of eventbuizz is designed to facilitate delegation of participation rights in polls and surveys. This feature is particularly useful when an attendee is unable to attend or participate, allowing them to grant authority to another colleague to act on their behalf.
Purpose
The primary purpose of the attendee authority sub-module is to ensure continuity and inclusivity in participation for events where attendees might face conflicts or be unavailable. By enabling attendees to delegate their authority, the module ensures that decisions and feedback can still be collected efficiently, without being hindered by individual absences.
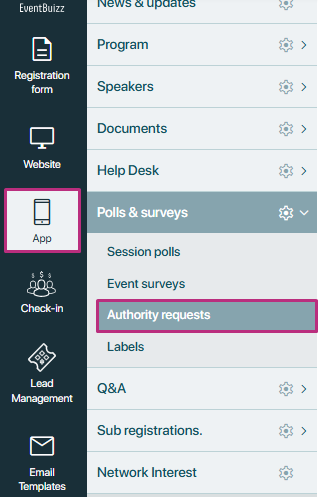
Enabling attendee authority
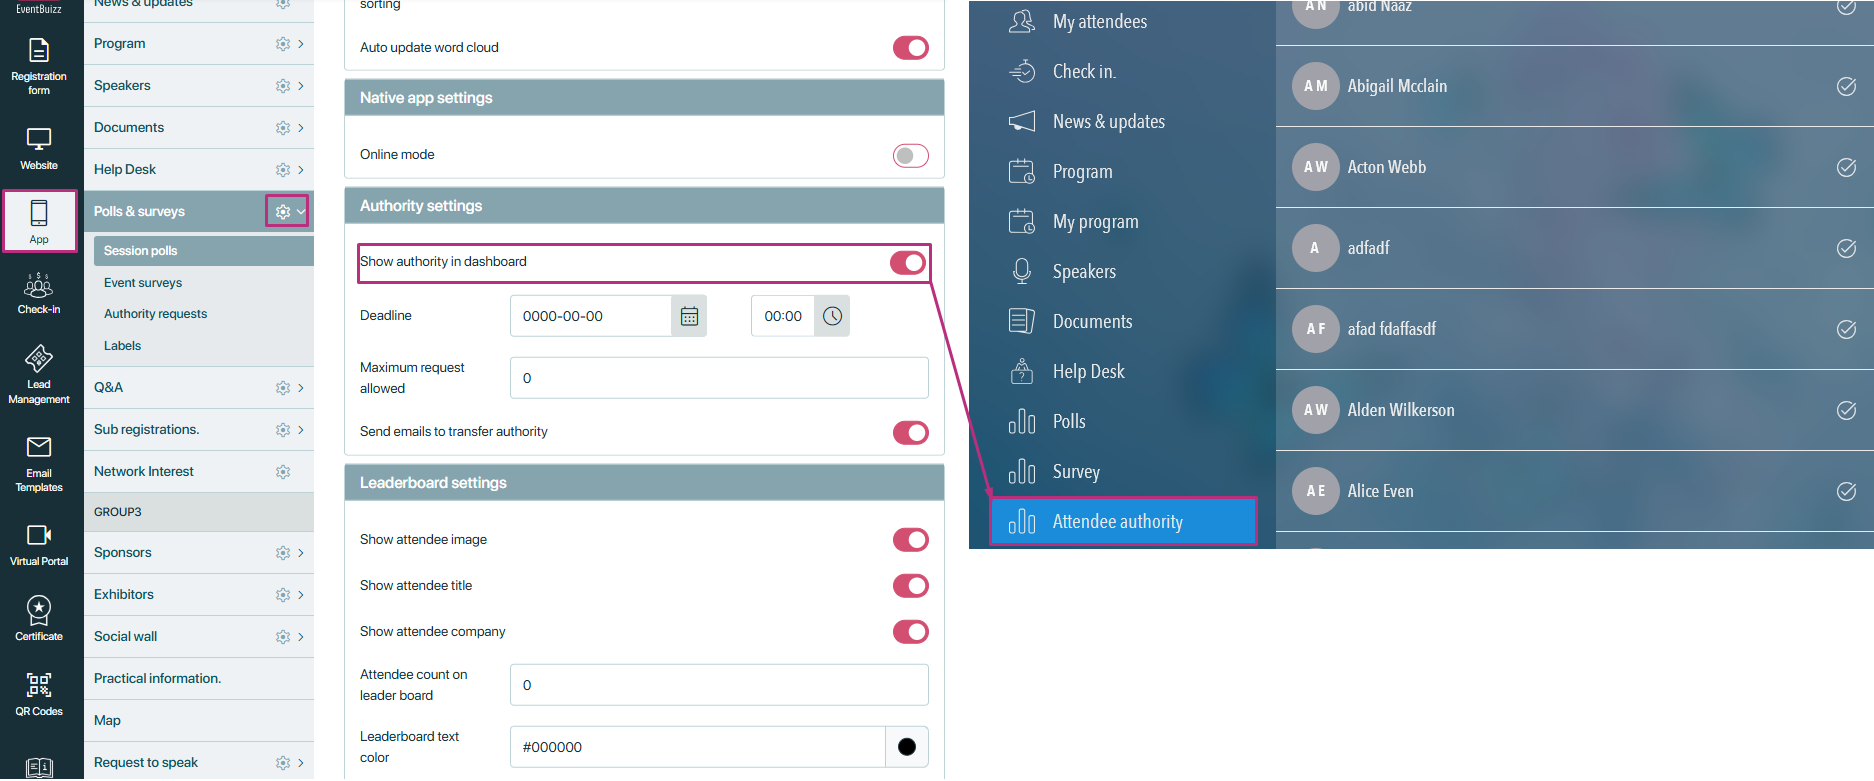
To enable the attendee authority sub-module, the organiser needs to follow these steps:
- Navigate to Eventcenter.
- Go to the app.
- Select the Poll & Survey module.
- Open Settings.
- Enable the “Show authority in dashboard” setting.
Once this setting is enabled, the Attendee Authority sub-module will appear in the web app below the poll and survey menu.
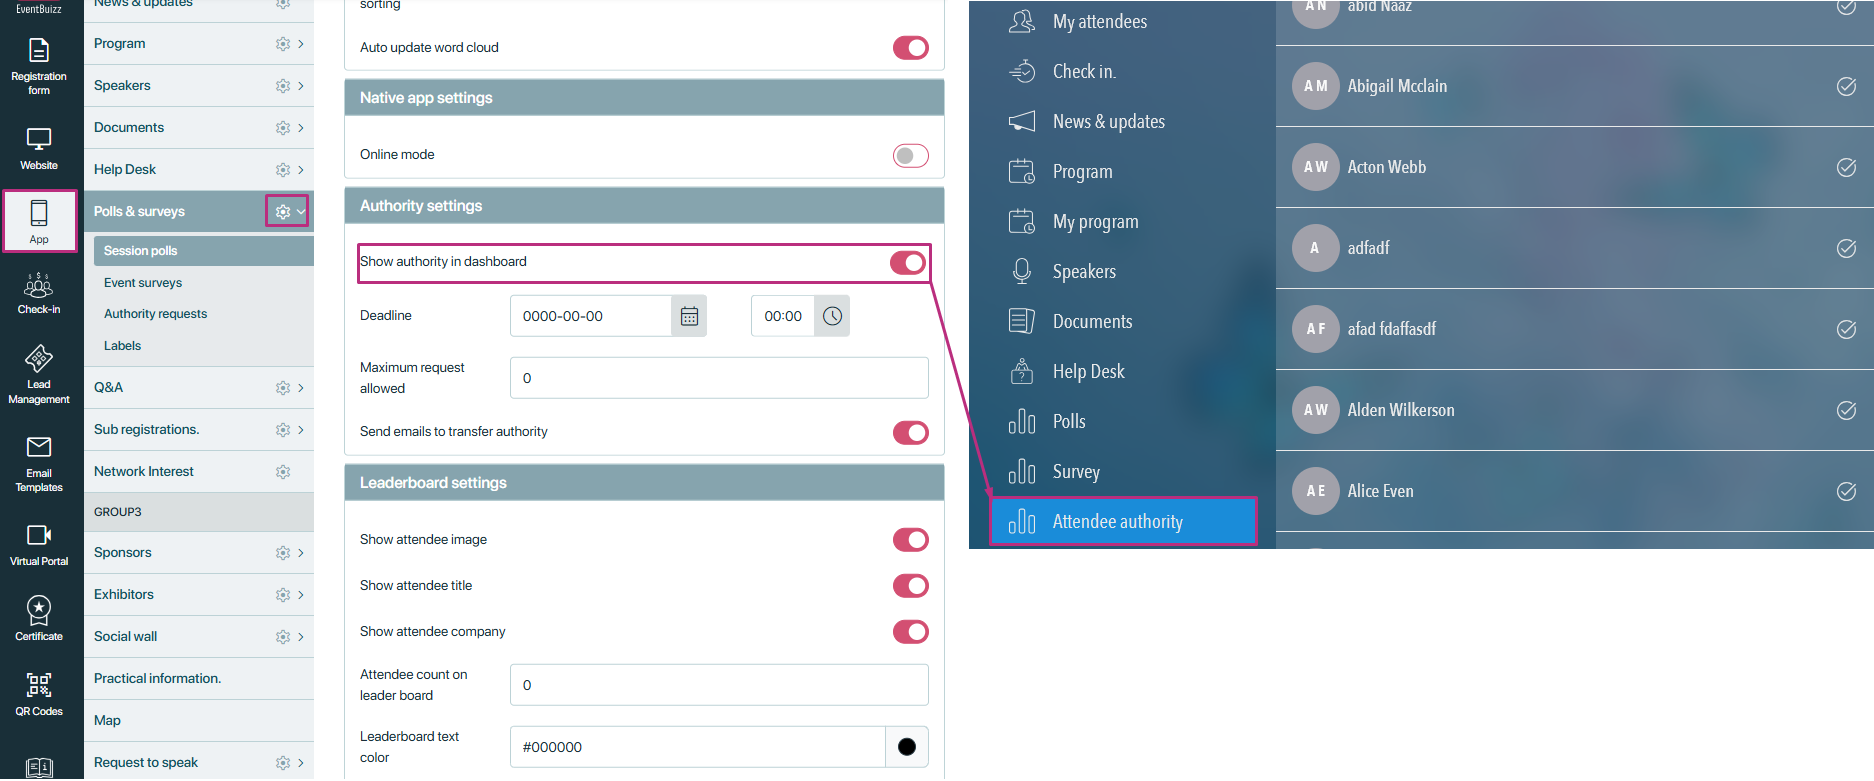
Using attendee authority
Attendee authority listing
When attendees or users click on the authority module, they will see a list of attendees. By default, 10 attendees are shown in the list. Users can search for other attendees, and the search results will display the relevant attendees.
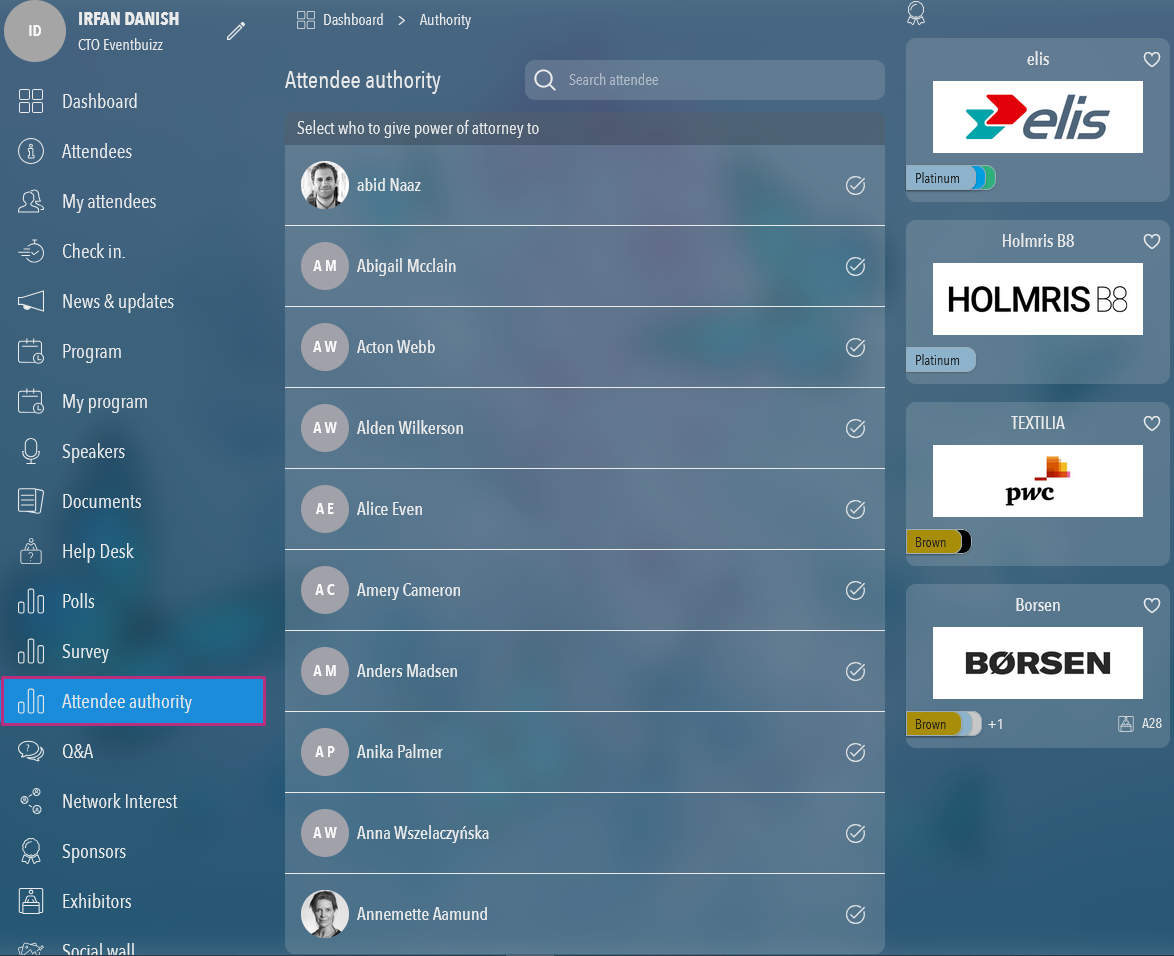
- All the attendee which are present in attendee list is the part of authority request, if any particular attendee is not showing on authority list just search it and result will find, on listing only 10 first by default attendee will show.
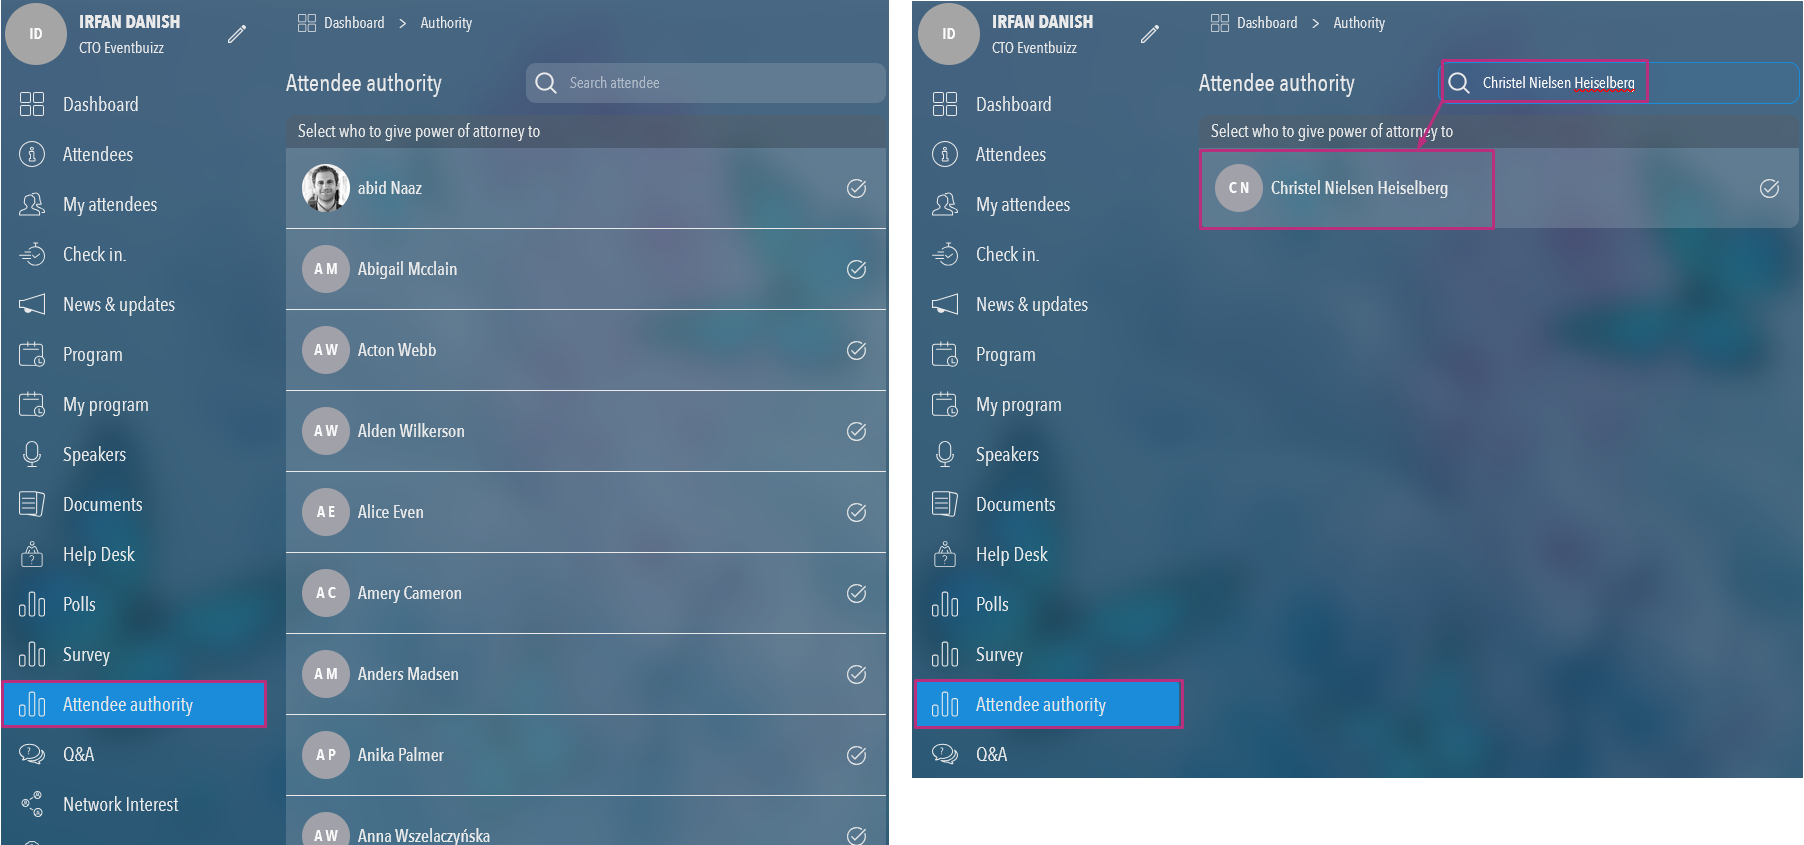
Transferring authority
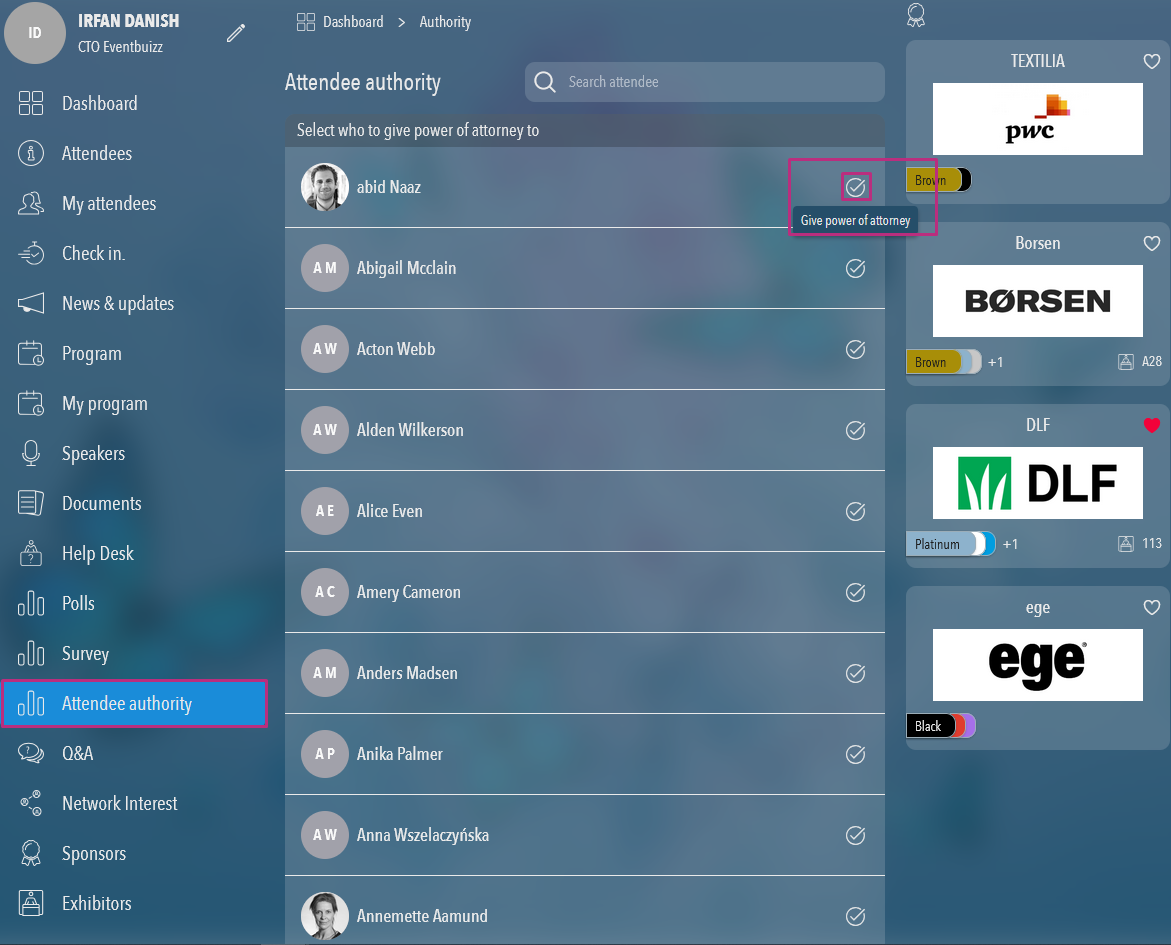
Each attendee in the list has an icon with a tick mark. Hovering over this icon shows a tool-tip labelled “Give power of attorney.”
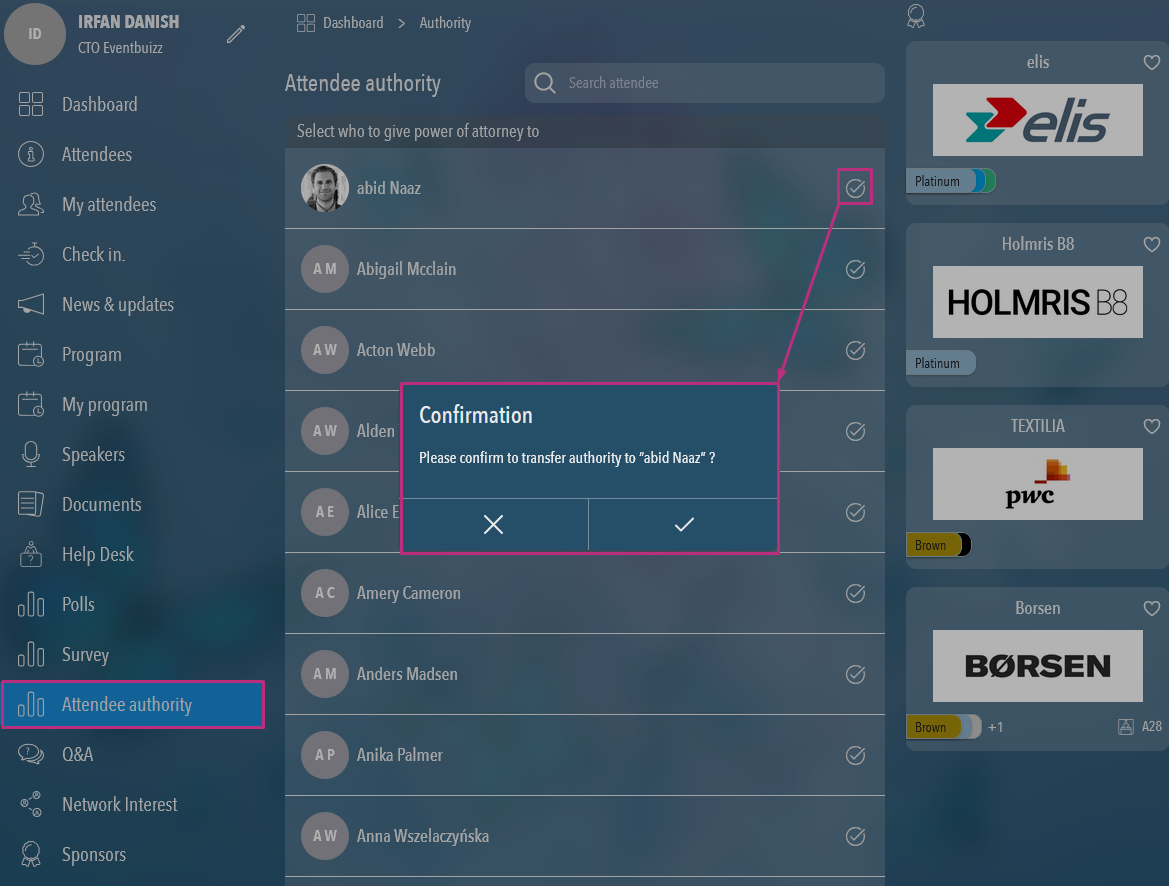
- Clicking this icon brings up a confirmation popup with the message:
- If the user clicks “Yes,” the authority is transferred, and a success message “Authority request sent successfully” is displayed.
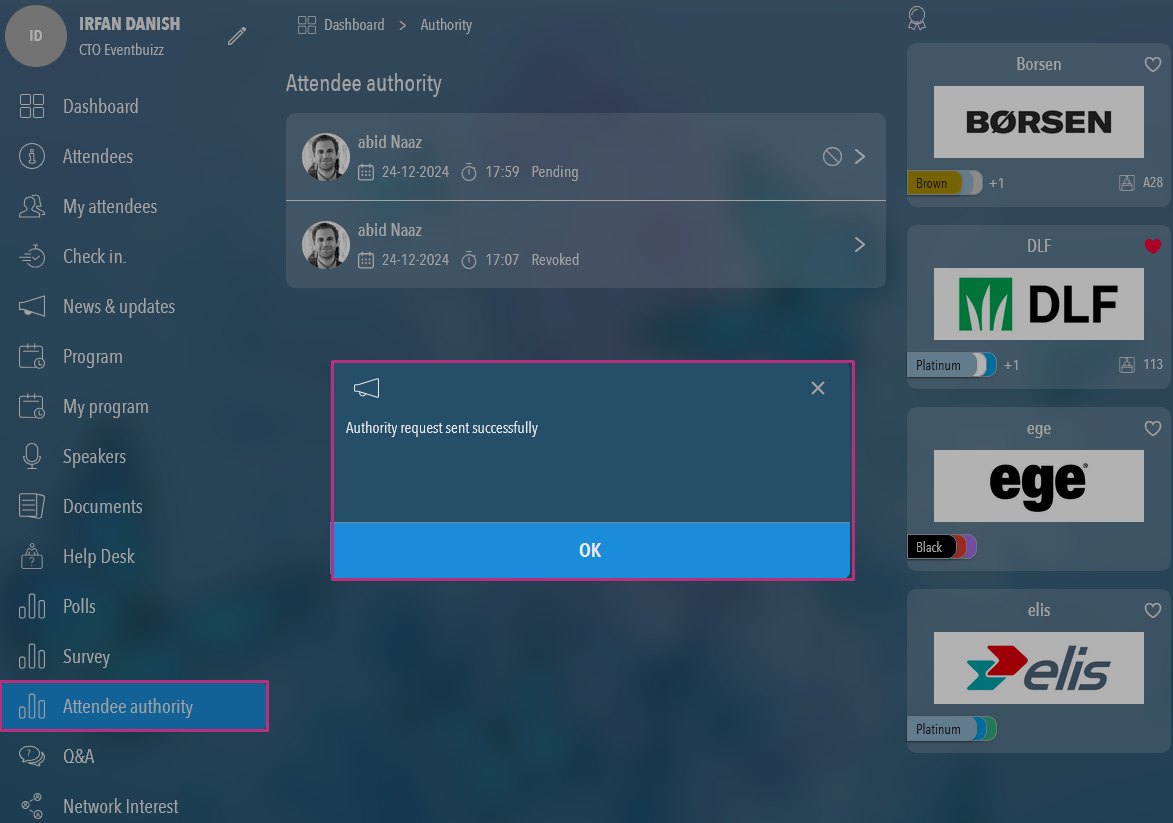
- All other attendees are hidden from the list, and only the selected attendee is shown.
- The poll and survey module will also be hidden from the menu list for the user who transferred their authority.
Authority request popup
When an attendee transfers authority, the recipient receives a popup with the following message “You have an authority request from “{attendee}””.
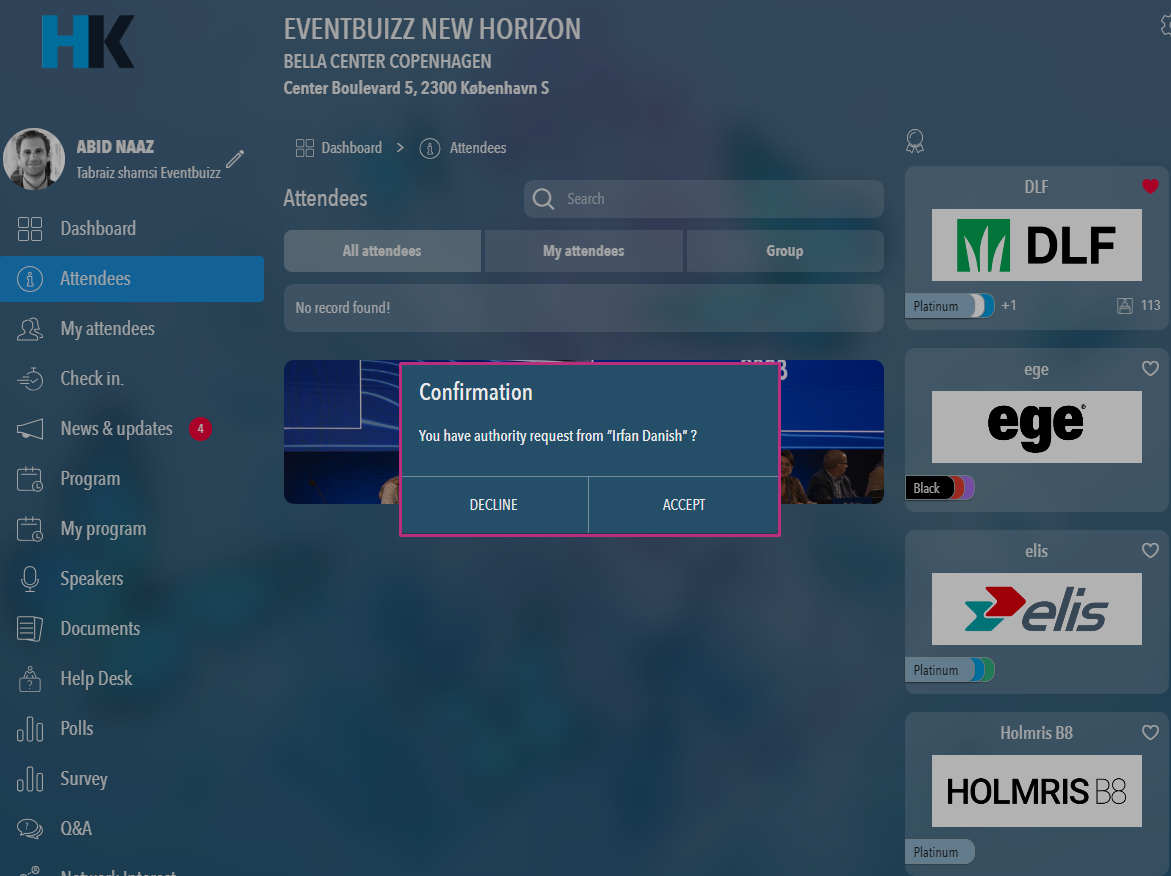
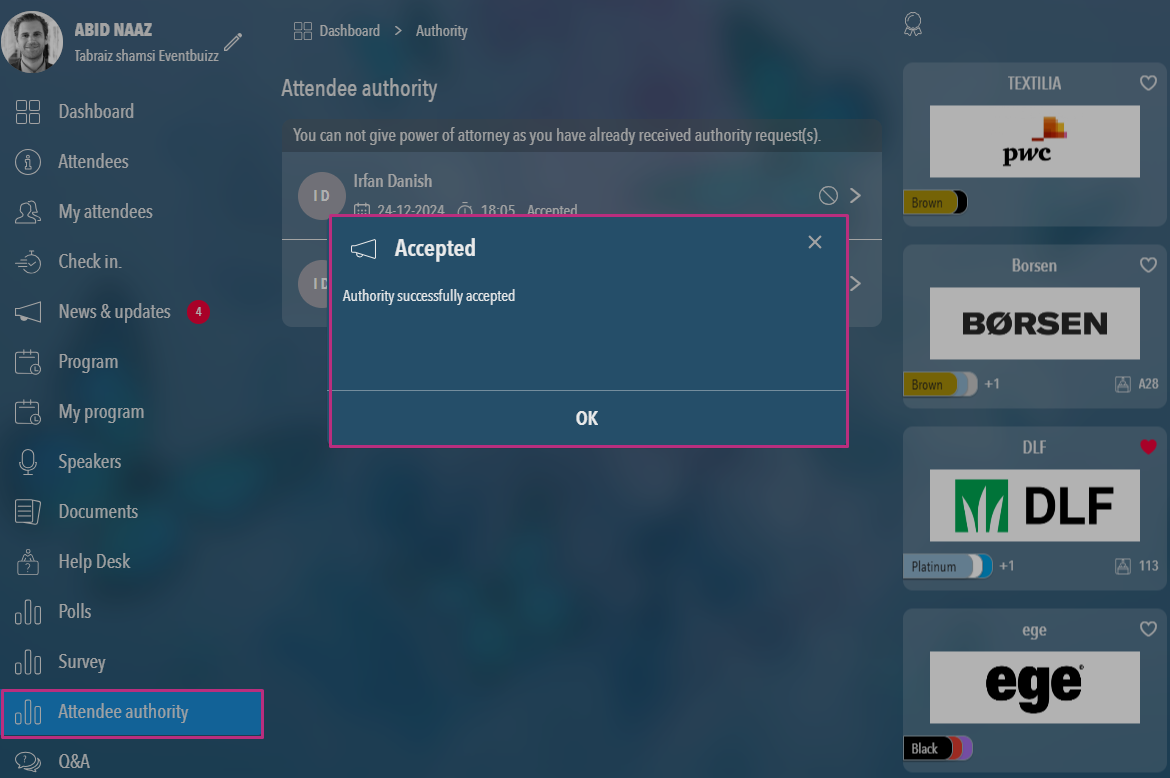
- If attendee accept the request then a success message will also show to that attendee as well.
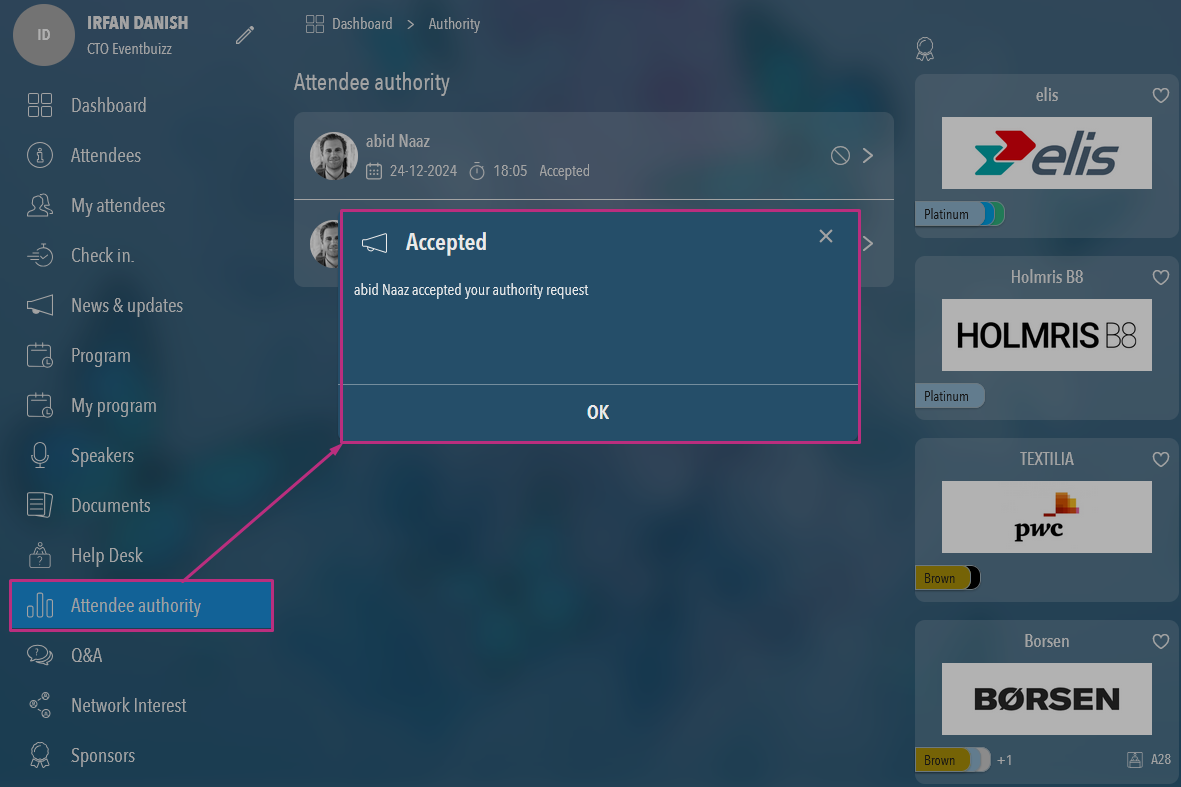
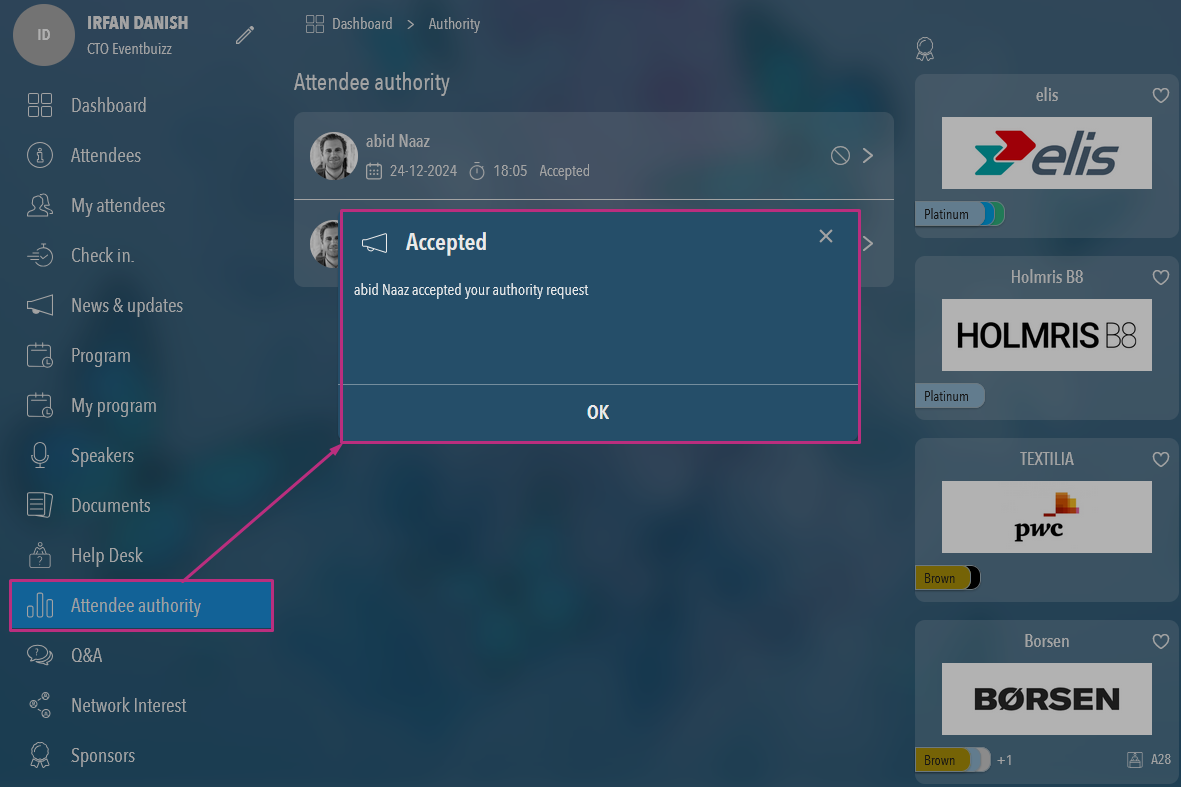
- When requested attendee accept the request, then the attendee who sent the request will receive a popup message “{Attendee} accepted your authority request”.
Revoking authority
- The attendee who received the authority can revoke it at any time by clicking the icon next to their name.
- By hovering on to the revoke icon, a tool-tip show with label of “Revoke power of attorney”.
- And by clicking on the revoke icon a confirmation popup with message “Are you sure to revoke authority to “{attendee}””.
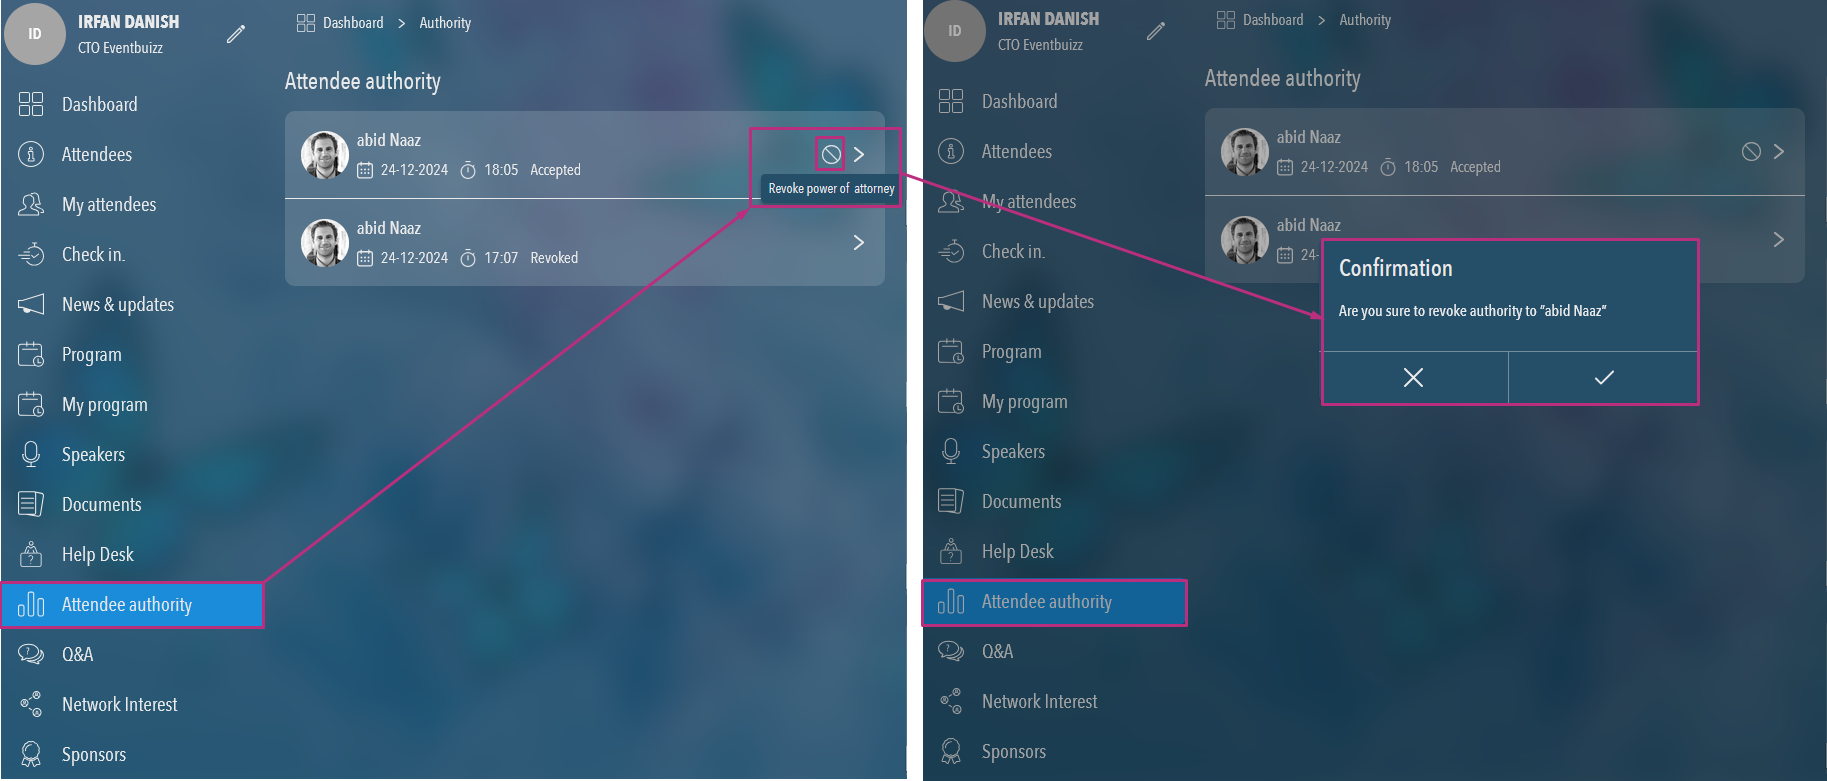
Viewing logs
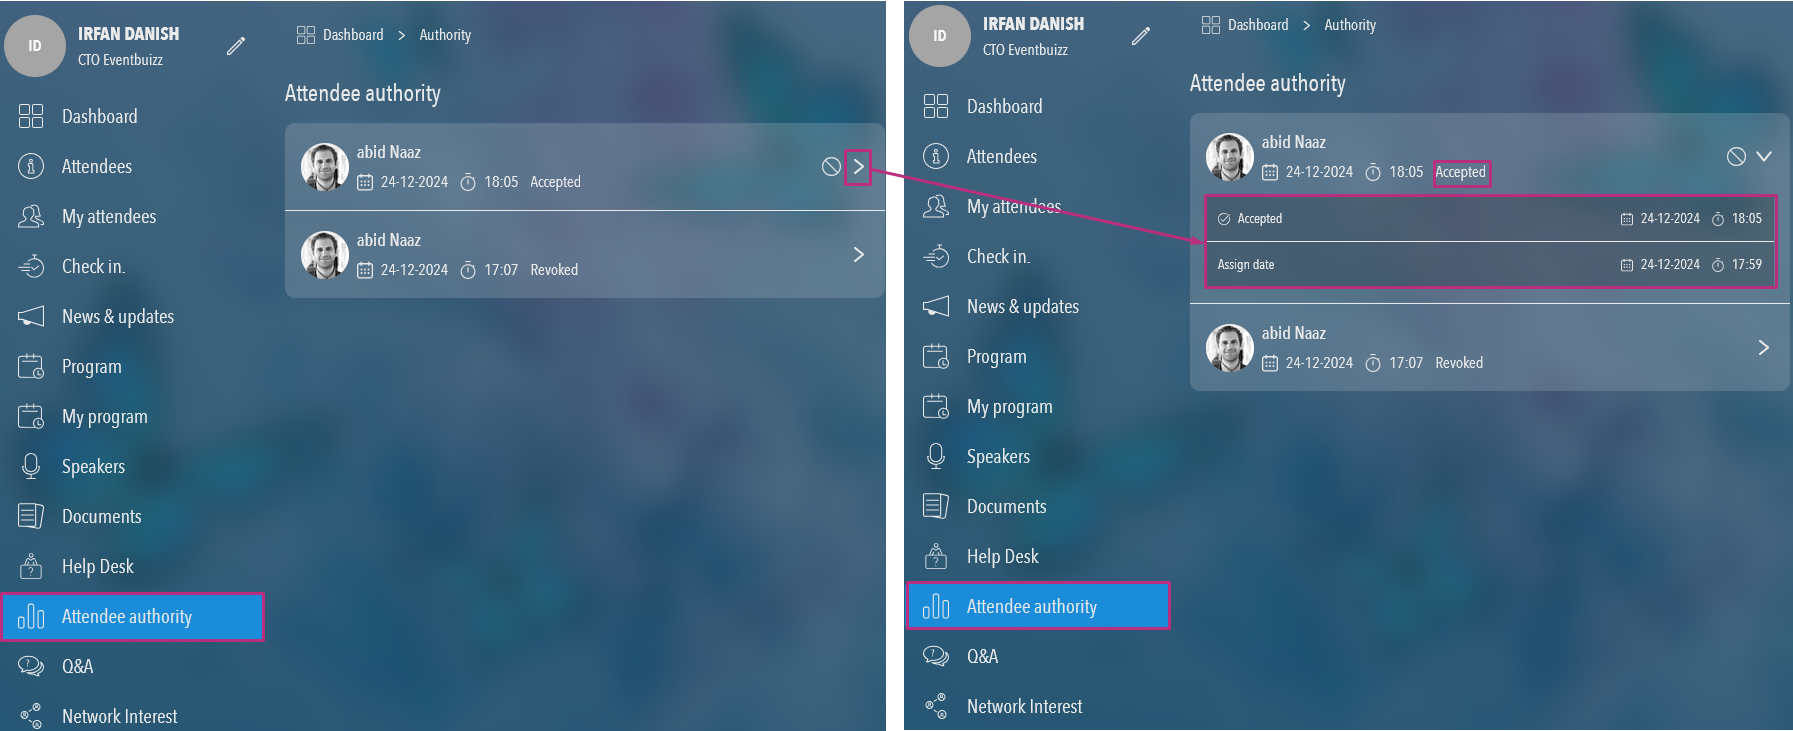
An arrow icon next to each attendee shows the logs, including the date and time when the authority was assigned. The logs also show the details of the authority transfer.
- If the recipient accepts the request, a log is generated with the date, time, and status marked as “Accepted.”
- If the recipient rejects the request, a log is generated with the date, time, and status marked as “Declined.”
Important note
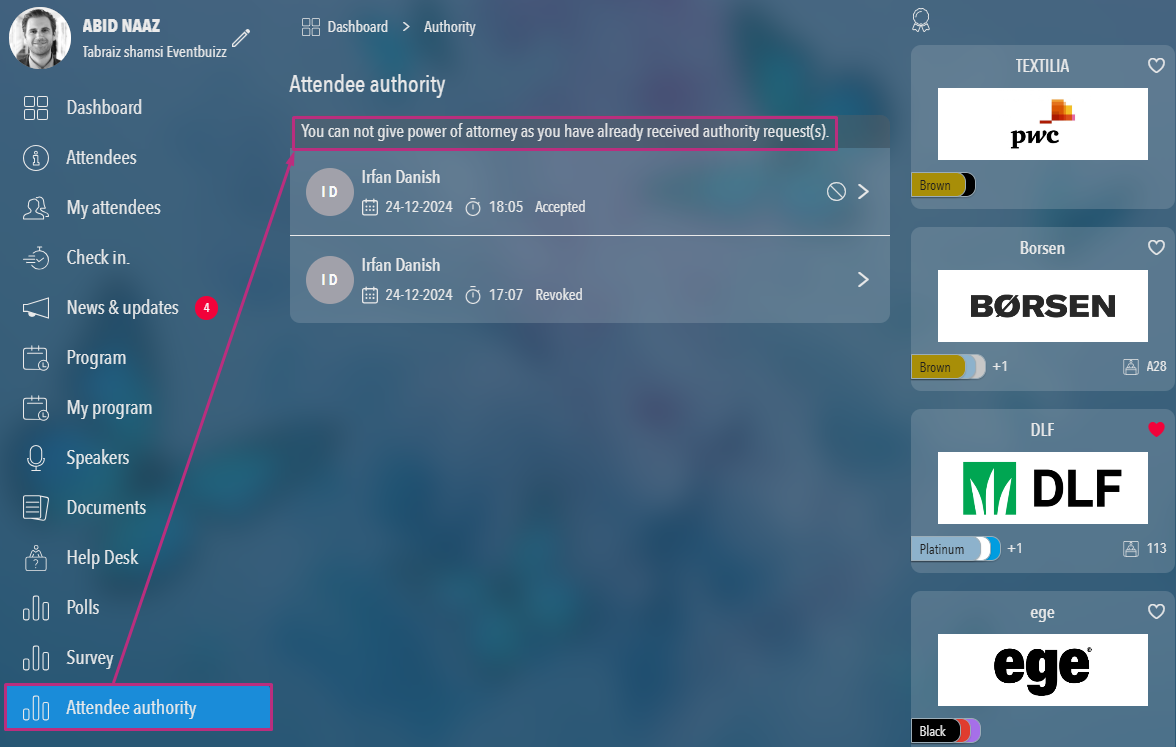
- Recipient attendee, who accepted the request can’t able to assign his authority to other attendee, and when navigate to the attendee authority on header of the container this message will show “You can not give power of attorney as you have already received authority request(s).”
Submitting polls and surveys
Once authority is accepted, the recipient can submit polls and surveys on behalf of the original attendee. When navigating to the poll and surveys module and selecting any poll or survey, the recipient sees a message indicating their right to submit on behalf of the attendee. The attendee’s name and profile are shown in the list.
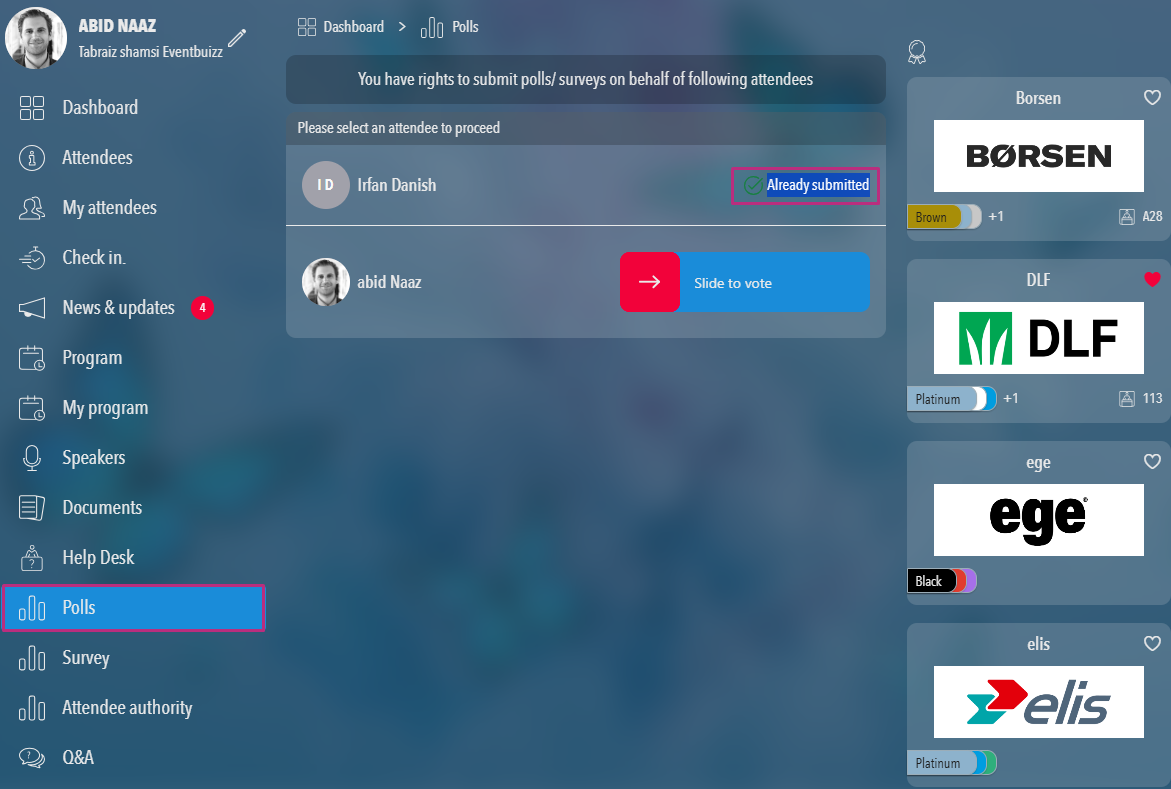
- The recipient can submit the poll and survey by sliding to vote in front of the attendee’s name.
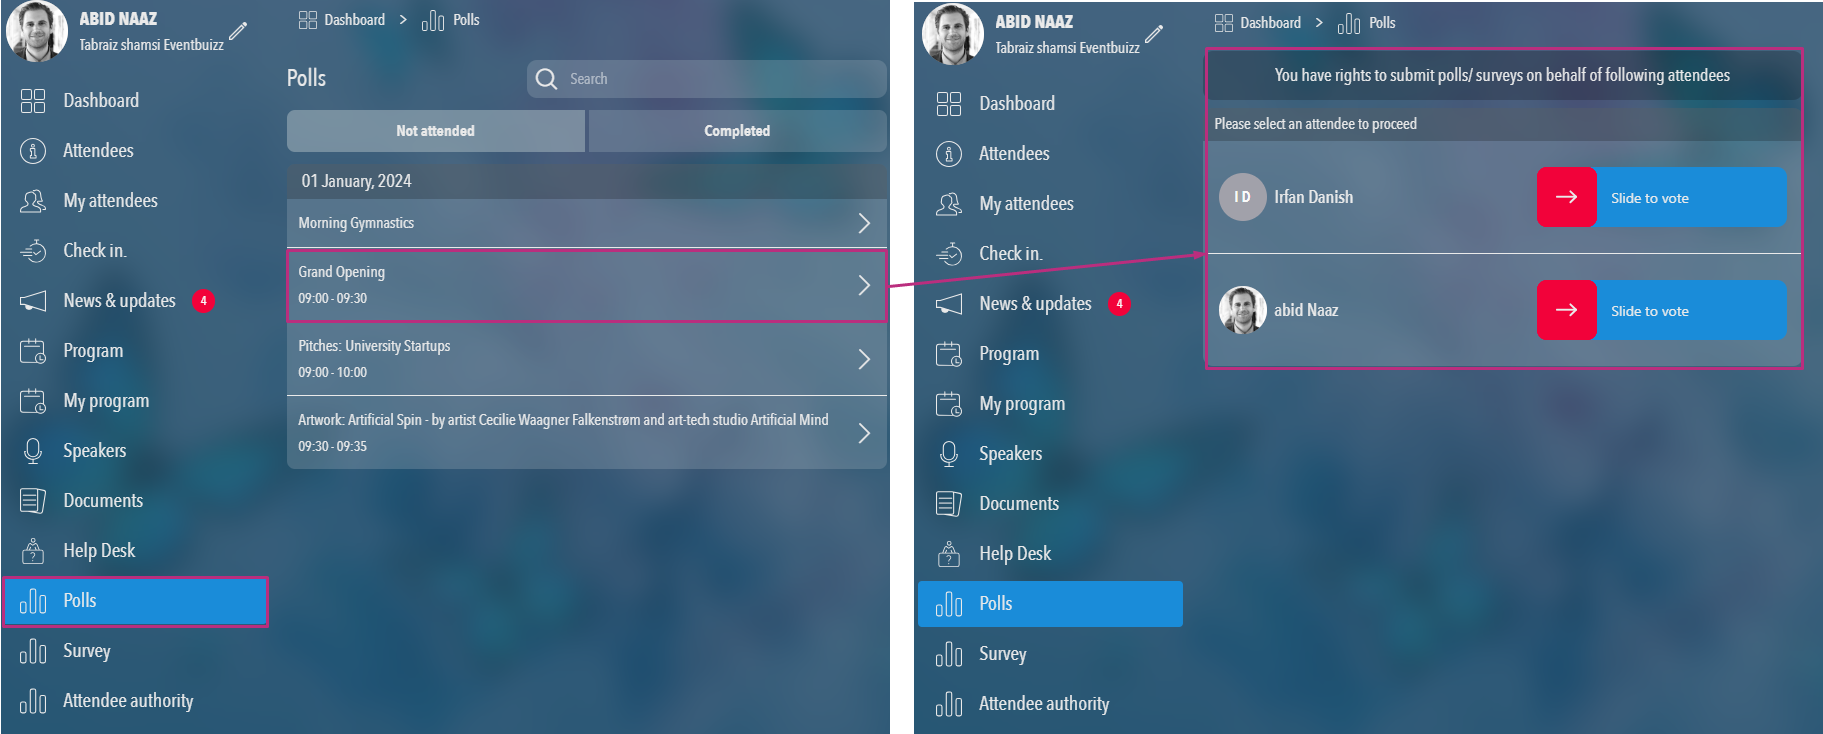
- Recipient attendee will chose the attendee from the attendee list against whom attendee want to submit poll/surveys.
- By completing the “slide to vote” slide, selected polls /surveys questions will appears and attendee will submit the answer.
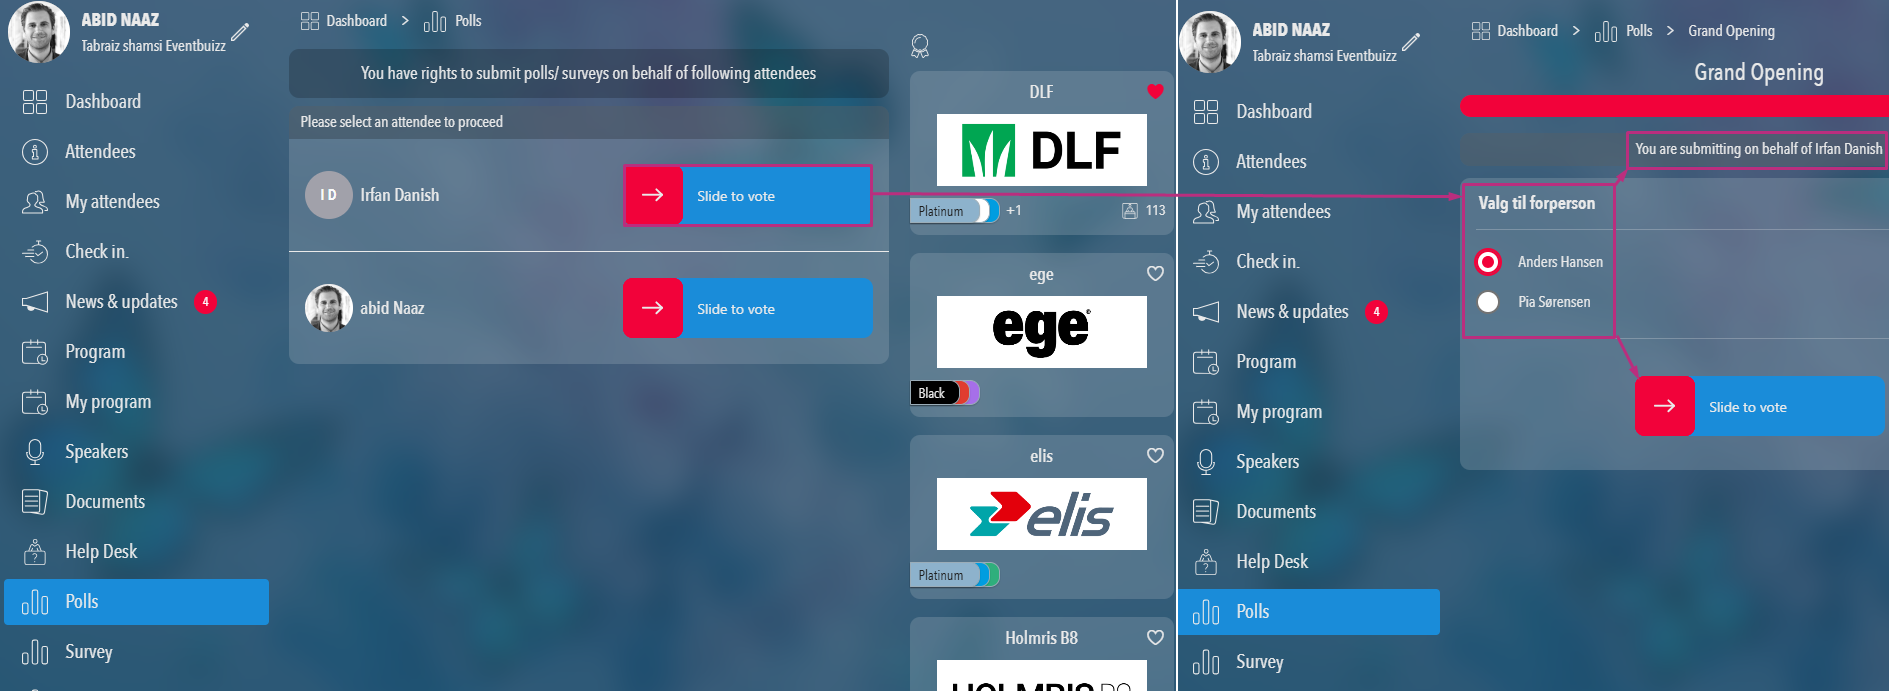
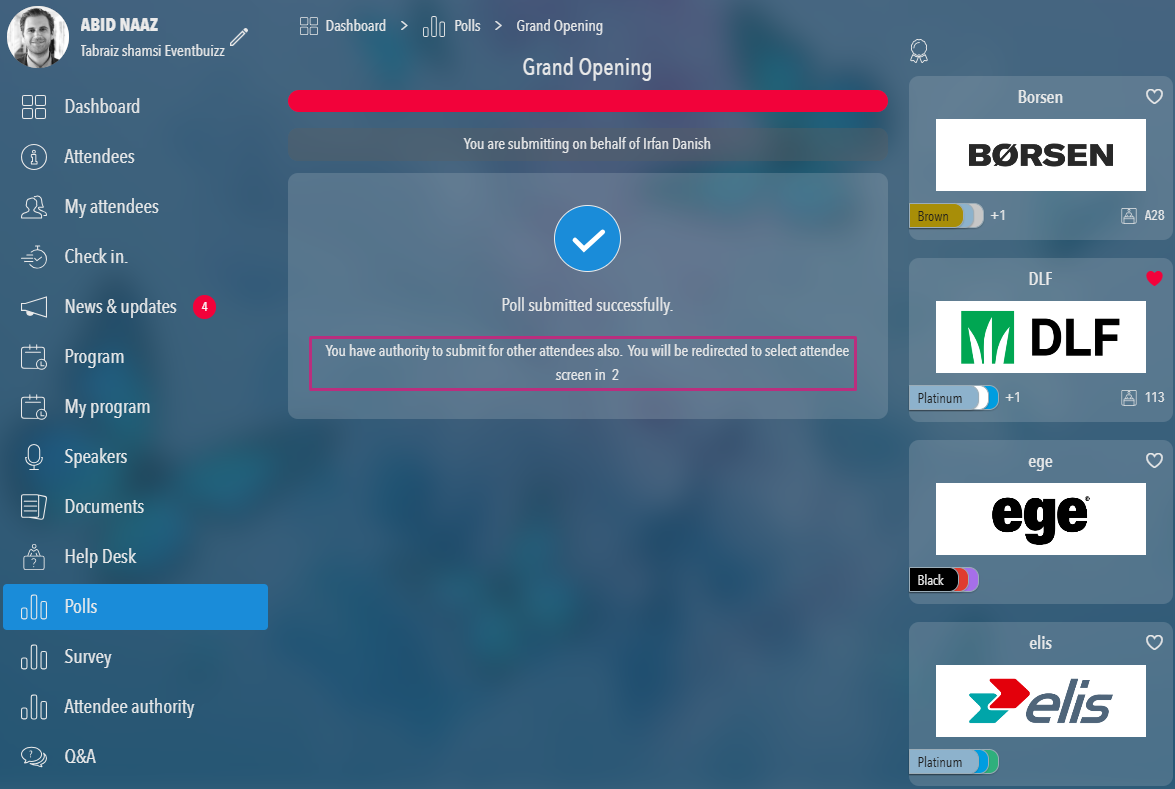
- When poll/surveys is just submitted a success message will show called “Polls/survey submitted successfully”.
- Below that label, a message also appears “You have authority to submit for others attendee also. You will be redirected to select attendee within in few seconds”.
- Once submitted, the status changes to “Already submitted” instead of “Slide to vote.”
pollssurveydownloadresults
Download results
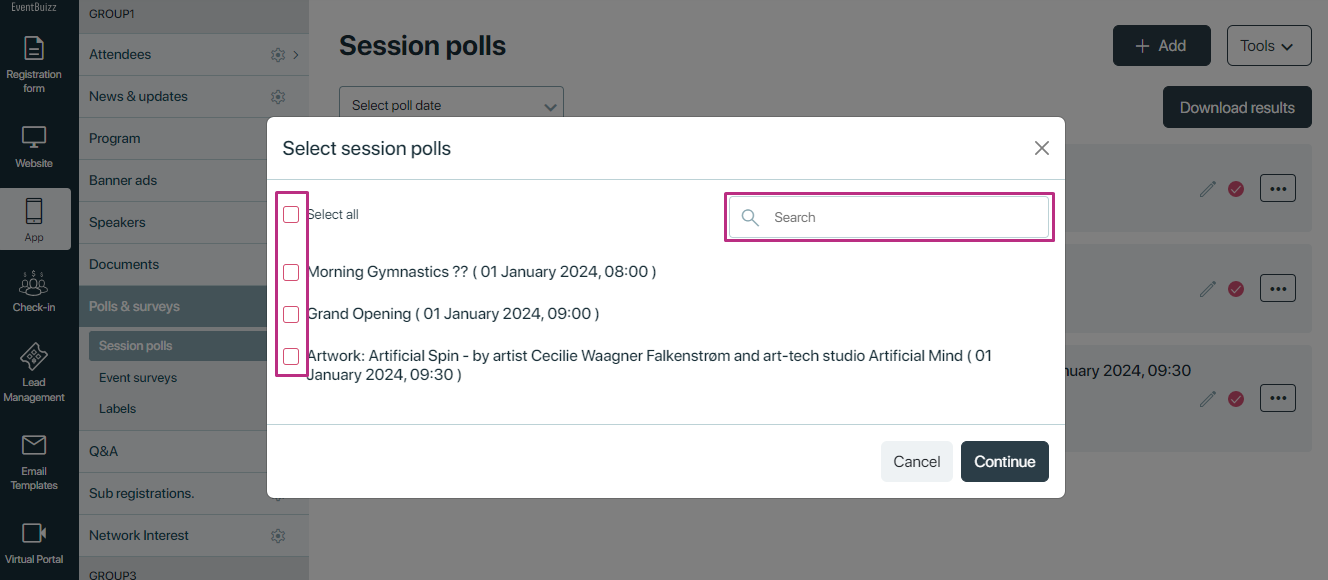
Clicking on “Download results” will open a new screen where all polls are listed. You can search for the required poll using the search bar and select the polls for which you want to download the results.
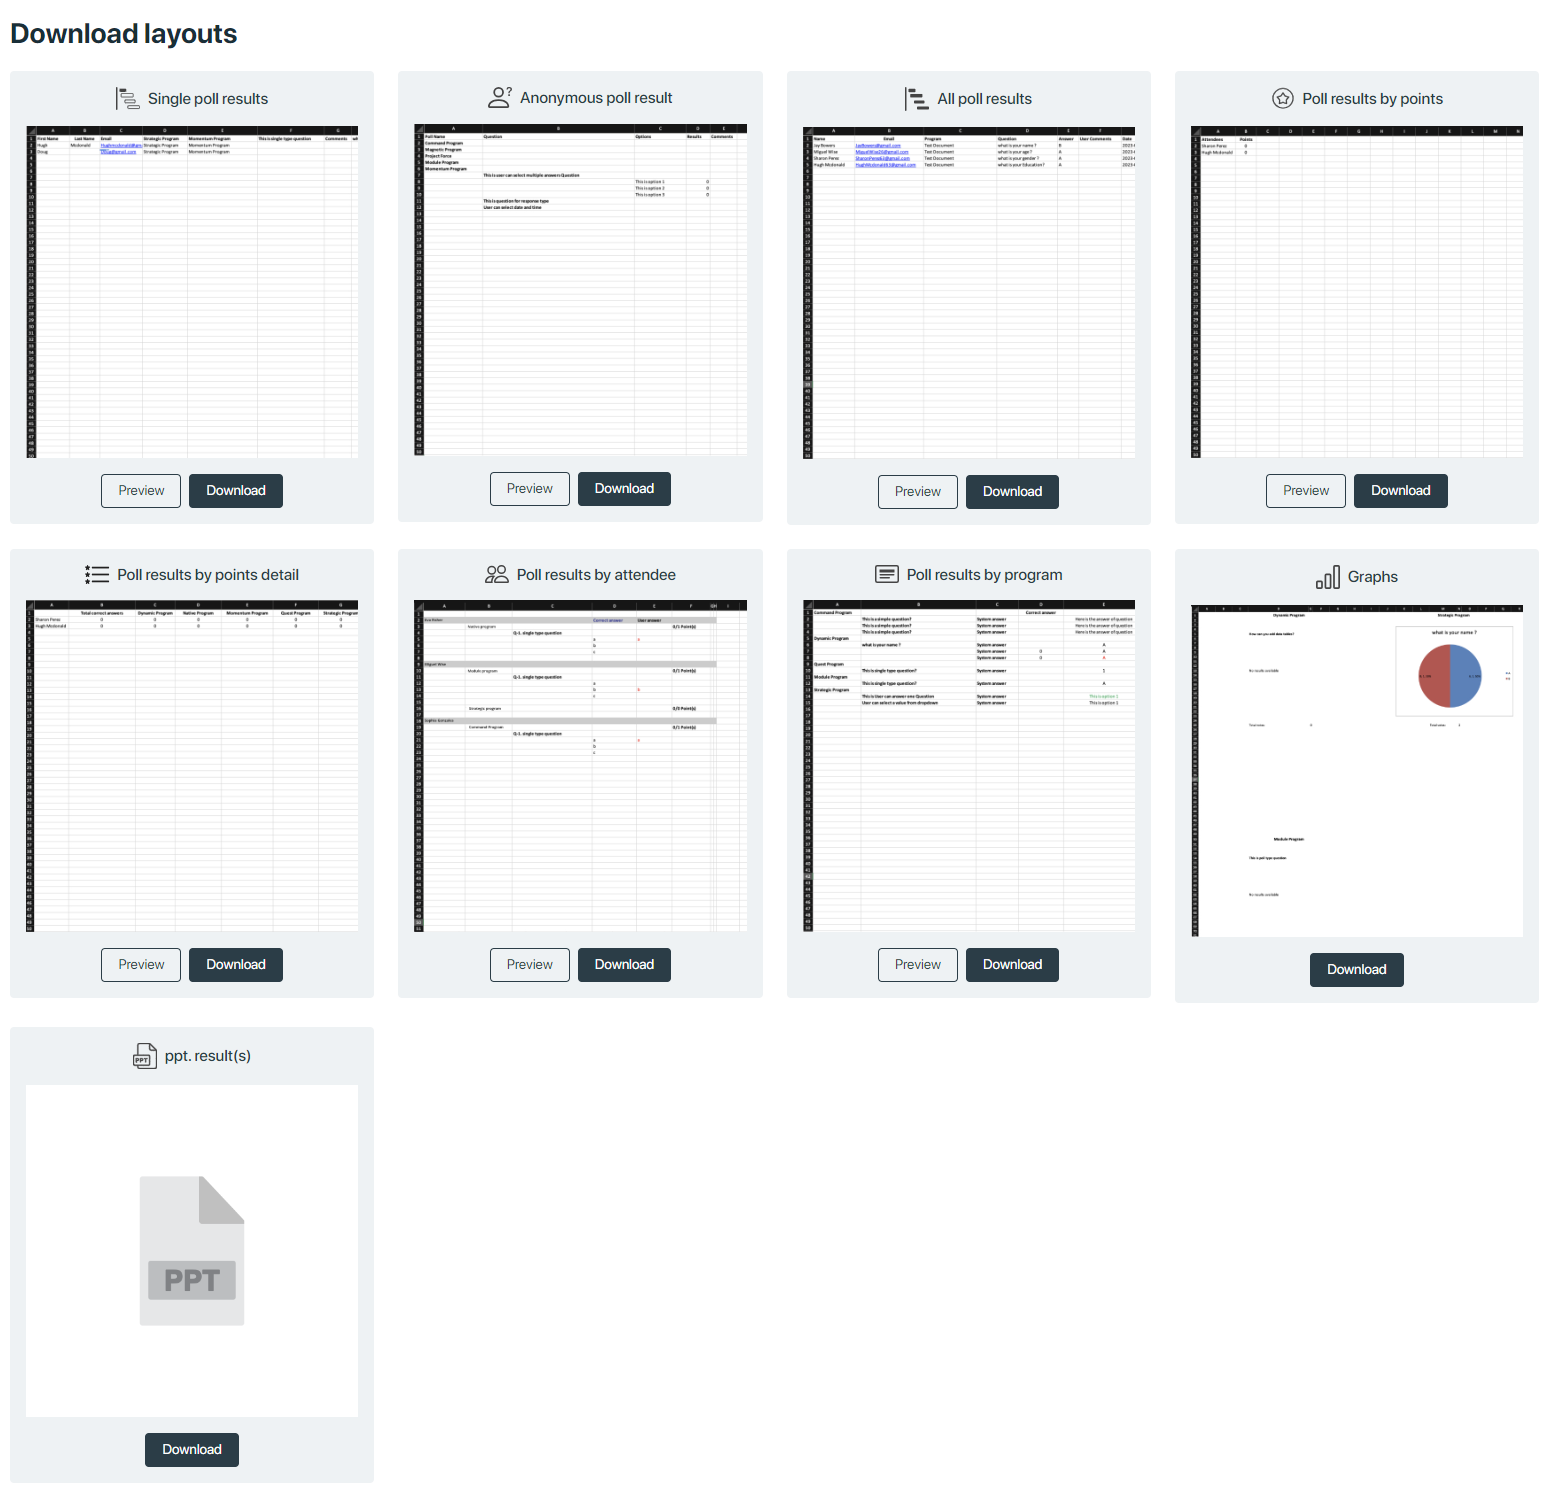
After selecting the poll, will open all download layouts. You can preview and download the required result format
pollssurveytools
Tools
We can import, export and download results from tools.
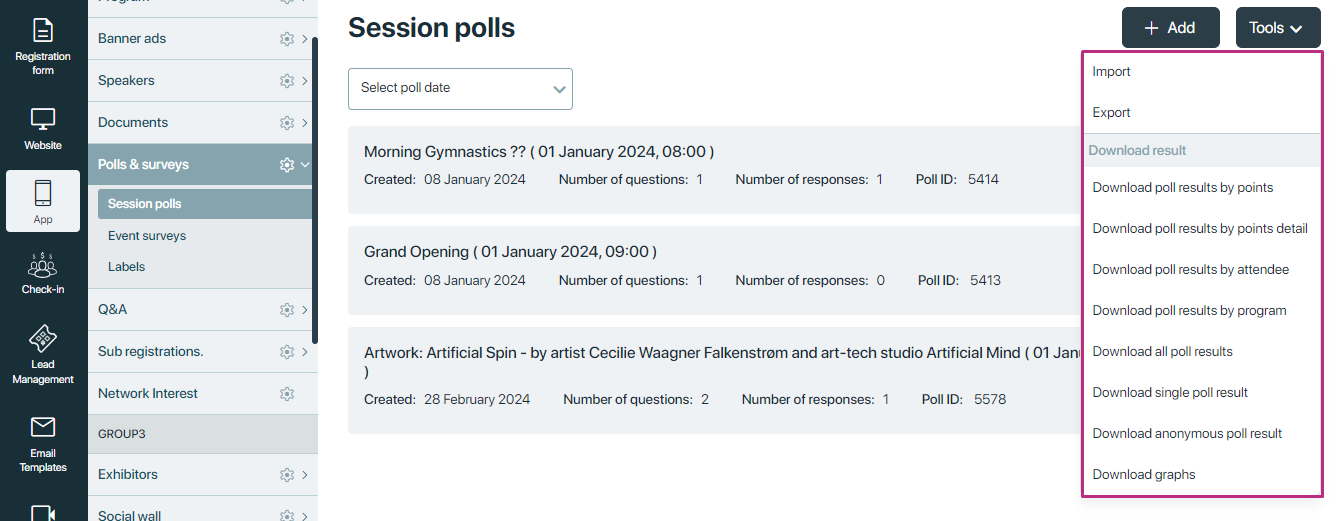
Export
All the polls or surveys listed can be exported along with their questions, poll/survey name, and program ID from here in csv file
Import
If you want to import polls/ survey directly into the system. Here’s a breakdown of the instructions.
-
- Click ‘Tools’ and choose Import.
- Use our csv template to copy/paste your data. you must have at least a program ID and poll name to create a poll. and survey name to create a survey.
- Select file and upload from your system.
- If you are updating information on existing attendees, then choose “create new records and update existing records”.
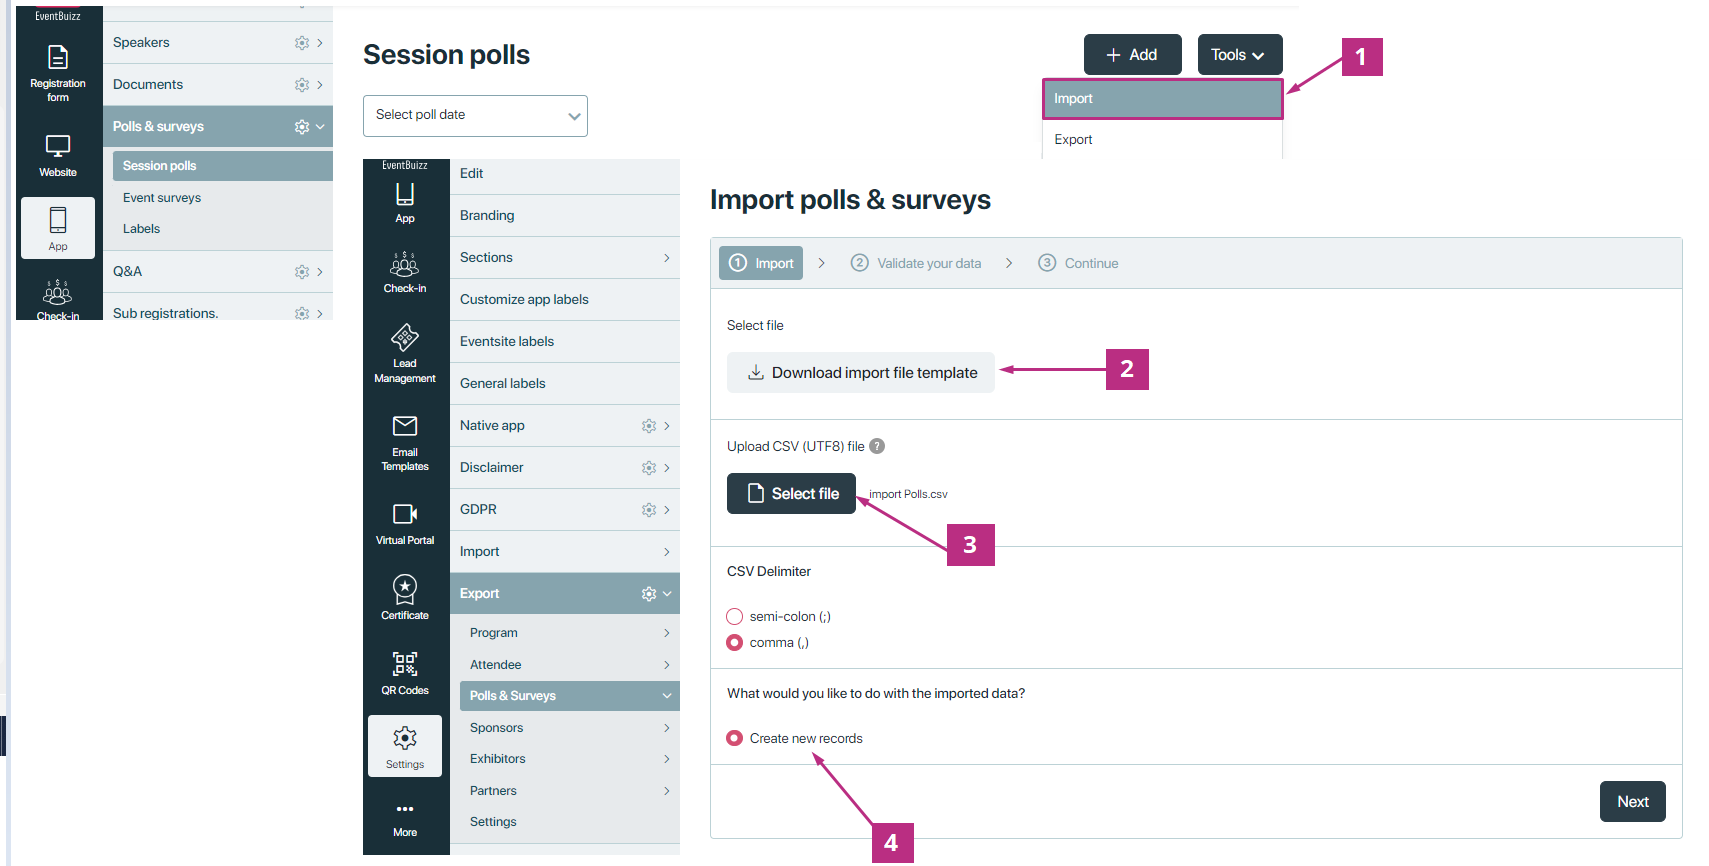
Download Import file template. Copy pastes all the relevant data you have. Save the CSV file on your pc.

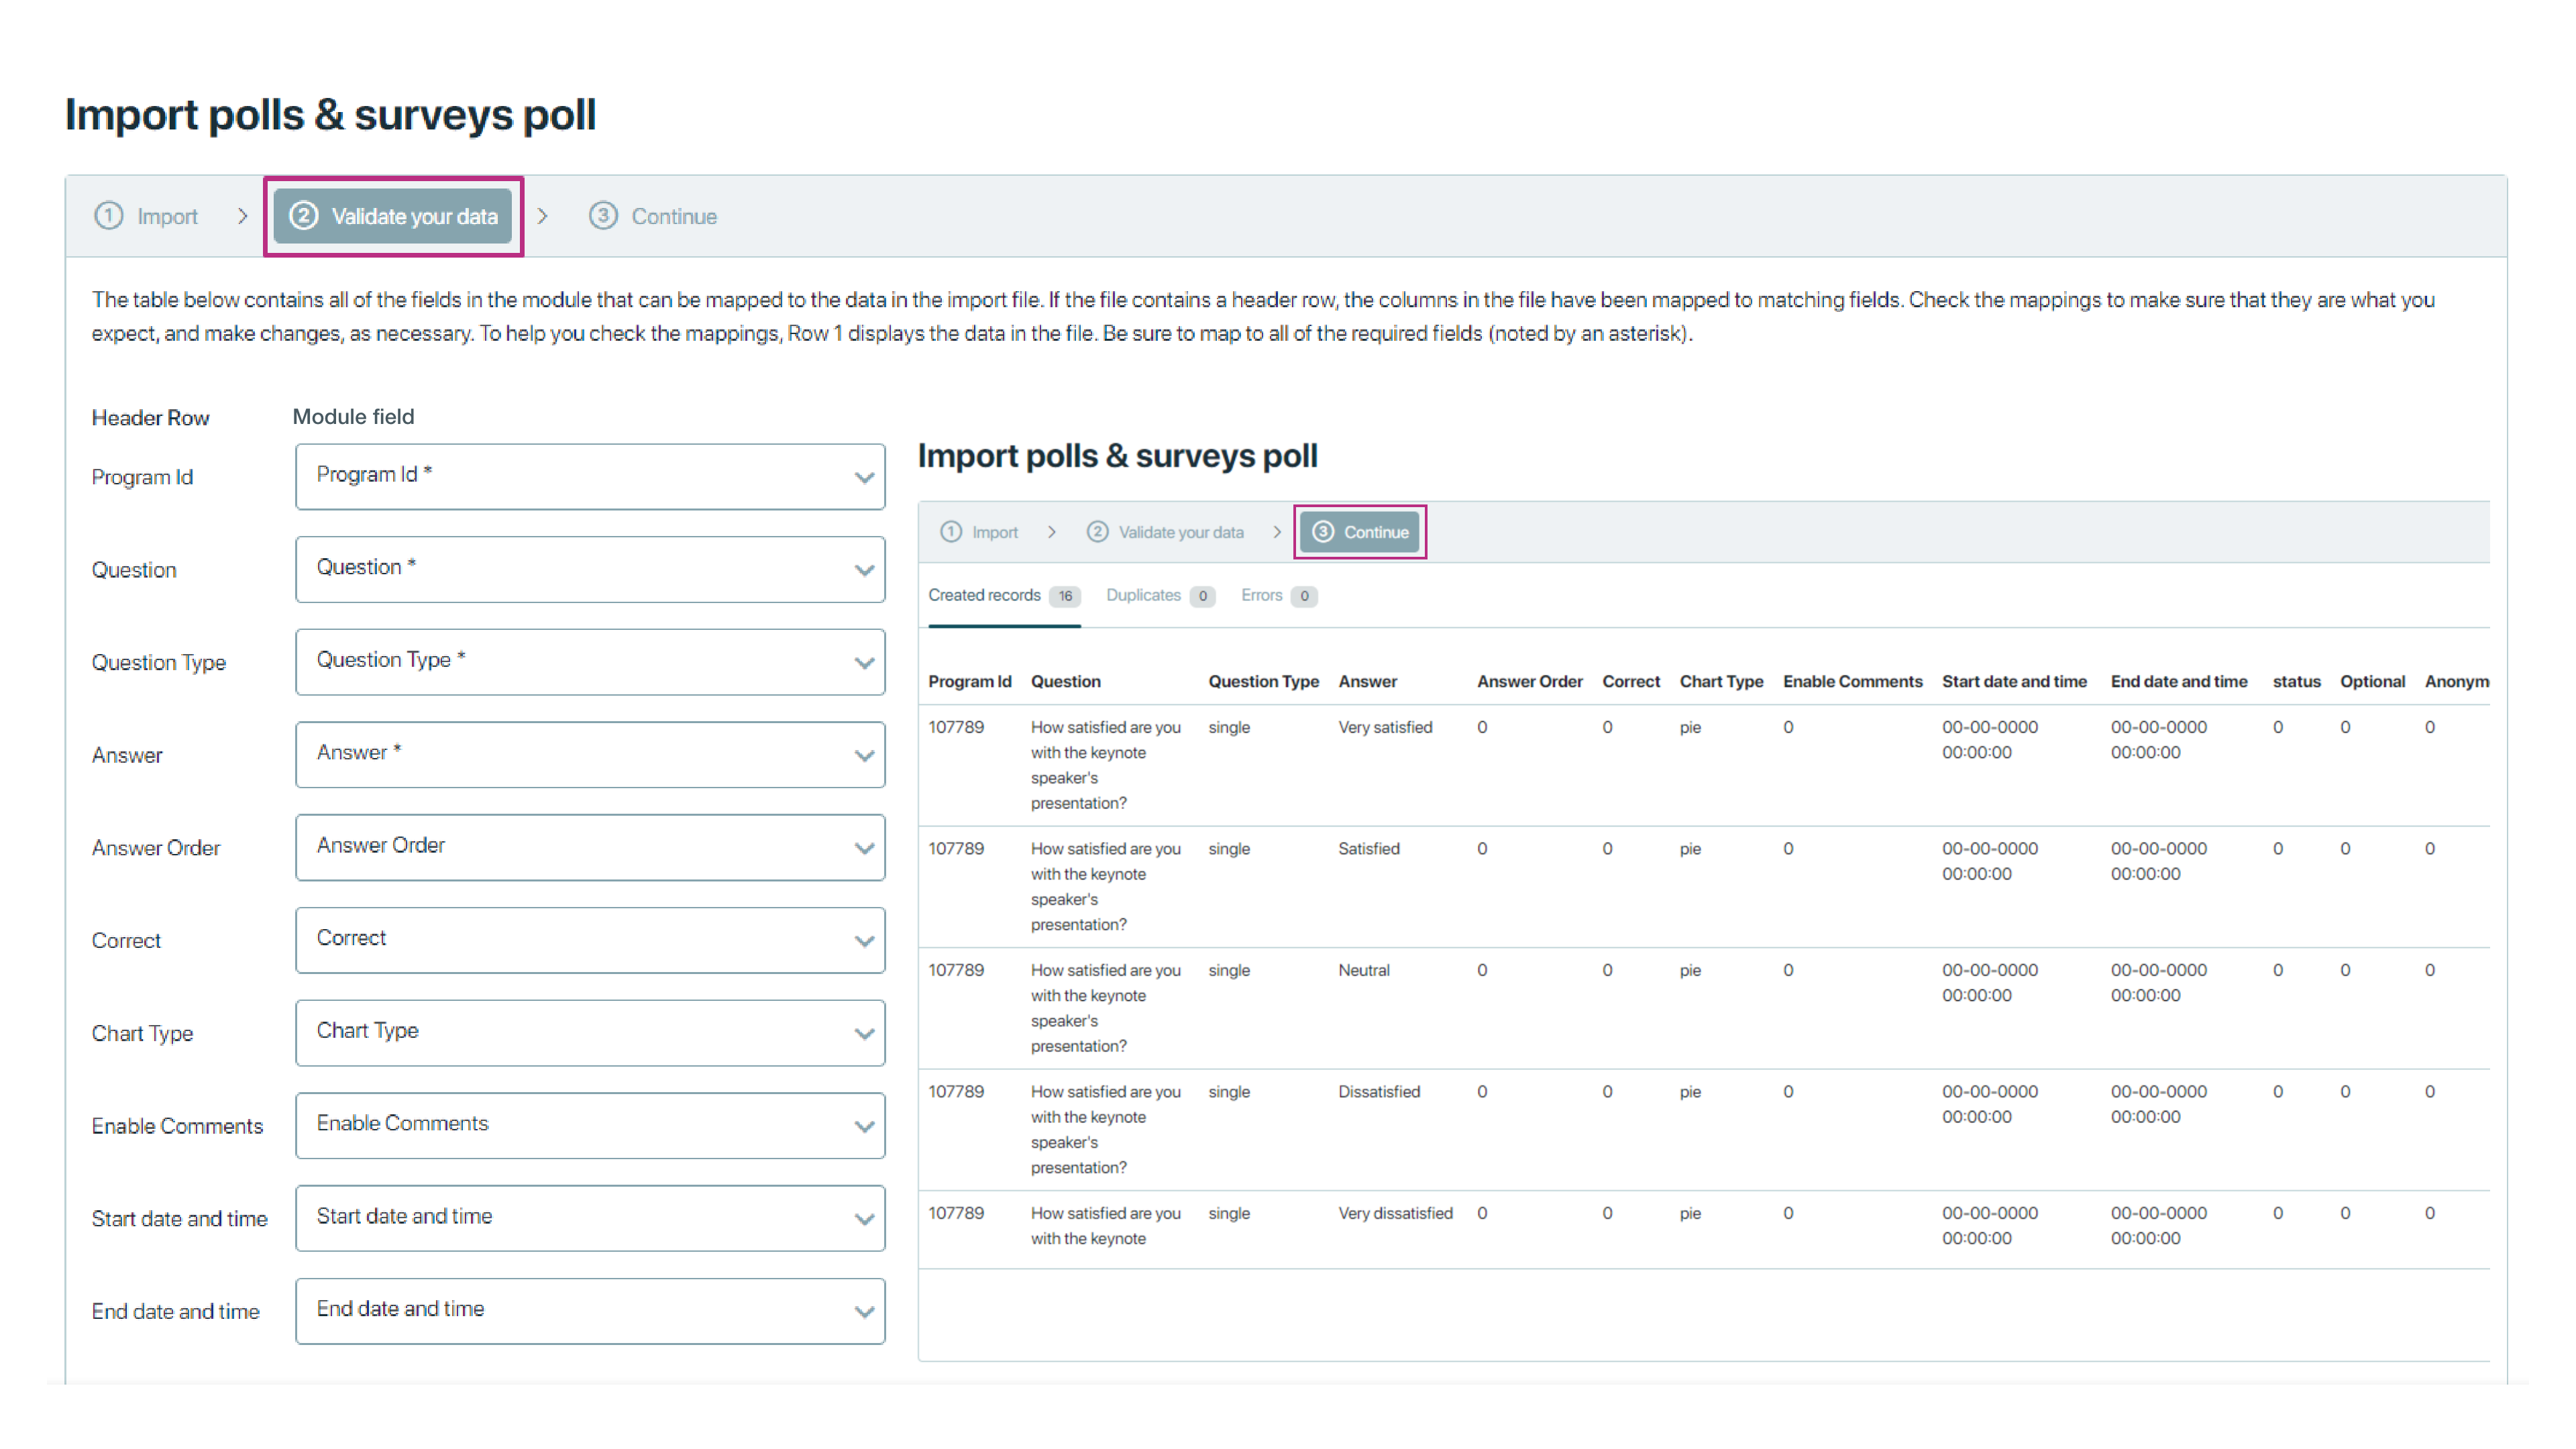
VALIDATIONS
| FIELDS | DESCRIPTION |
| Program ID | A unique identifier for the event or program to which the poll belongs. Program ID must be a valid ID that matches an existing programs. |
| Question | The text of the poll or survey question. Must be a non-empty string, providing clear and concise wording for the question. |
| Question type | Specifies the type of question (e.g., single, number, multiple choice, text response, date, date and time, dropdown, word cloud and matrix). |
| Answer | The possible answers for the question. Must be provided for question types that require predefined answers (e.g., single, multiple choice and dropdown). Can be left empty for text response questions. |
| Answer order | The order in which the answers should appear. Must be a numeric value started from 0 indicating the sequence of the answers. This answer order used in single, multiple choice and dropdown question. |
| Correct | Indicates the correct answer for the question, if applicable (e.g., for quizzes). Must match one of the provided answers if the question type requires a correct answer. |
| Chart type | The type of chart to display the results (e.g., bar chart, pie chart). |
| Enable comments | Specifies whether participants can leave comments. Must be a Boolean value (1/0). |
| Start & end date/ time | The date and time when the poll/survey will become active. Must be in a valid date-time format and in the future relative to the import date. This is used to schedule a question. |
| Status | Indicates the current status of the poll/survey (e.g., active, inactive). It must be a Boolean value (1/0). |
| Optional | Specifies whether answering the question is optional or mandatory. Must be a Boolean value (1/0). |
| Anonymous | Indicates if the poll/survey responses are anonymous. Must be a Boolean value (1/0). |
| Max option | The maximum number of options a participant can select. Must be a numeric value, applicable for multiple-choice questions allowing multiple answers. |
| Min option | The minimum number of options a participant must select. Must be a numeric value, applicable for multiple-choice questions allowing multiple answers. |
Import a file -> by clicking on Select File
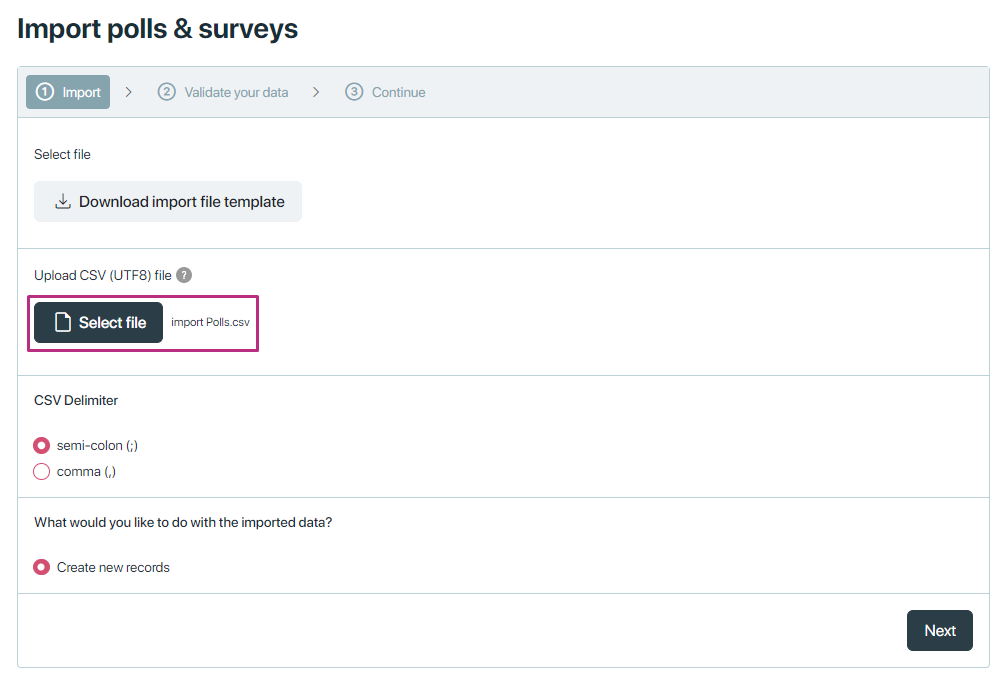
If you have used our template, you do not need to do any changes in mapping, just click ‘Next’. If you use your own CSV file – where the columns are name differently, please map the relevant information.
pollssurveysettings
Settings
These settings allow event organizers to customize the way poll and survey information is presented to attendees, enhancing engagement and ensuring that the data is displayed in a clear and visually appealing manner.
Display Settings
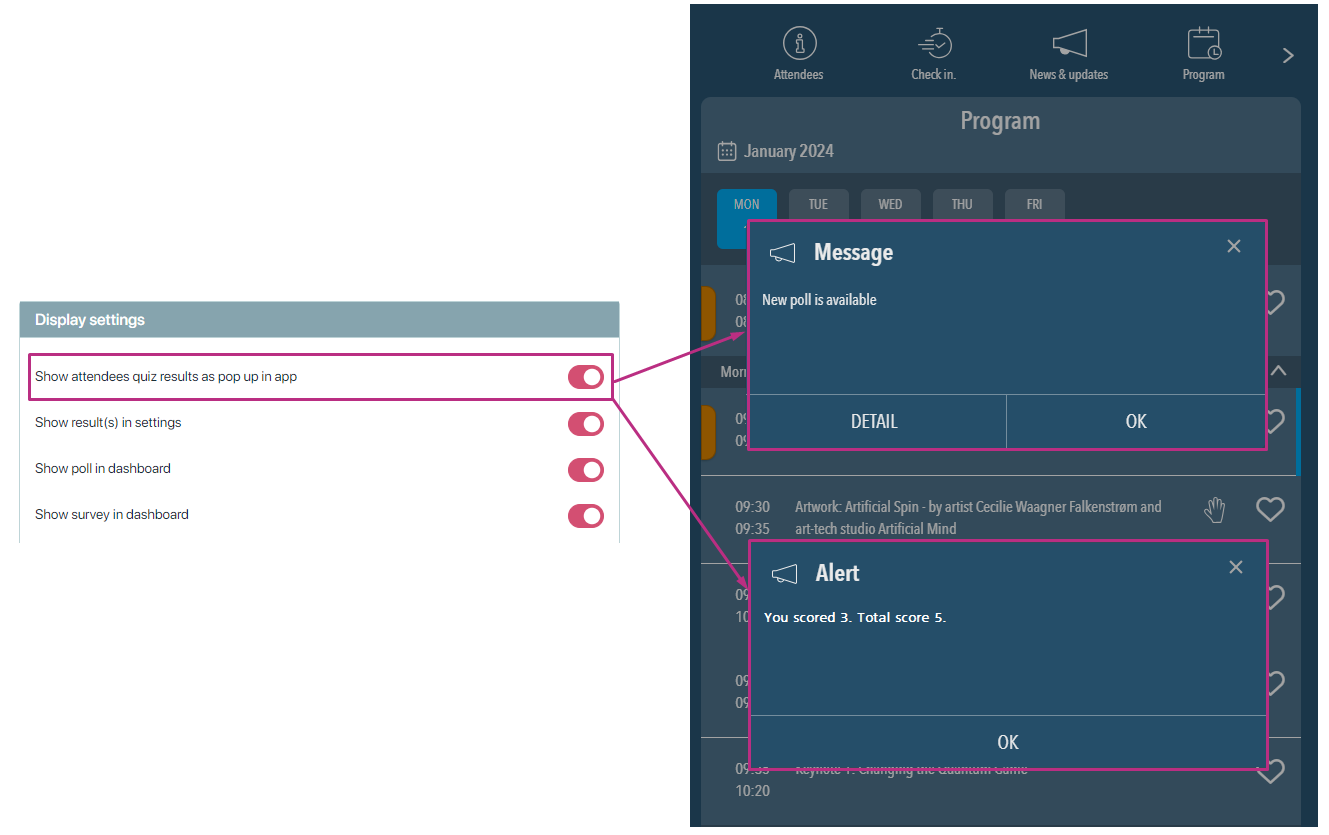
Show attendees quiz results as pop up in app: This setting enables the functionality to display the availability of new poll/ survey and display the results of quizzes taken by attendees as a pop-up notification within the app. It allows participants to see their scores immediately after completing a quiz.
On alert for new poll/ survey we have two buttons:
-
-
- OK: It will close the pop up.
- Detail: It will take you to poll/survey to answer.
-
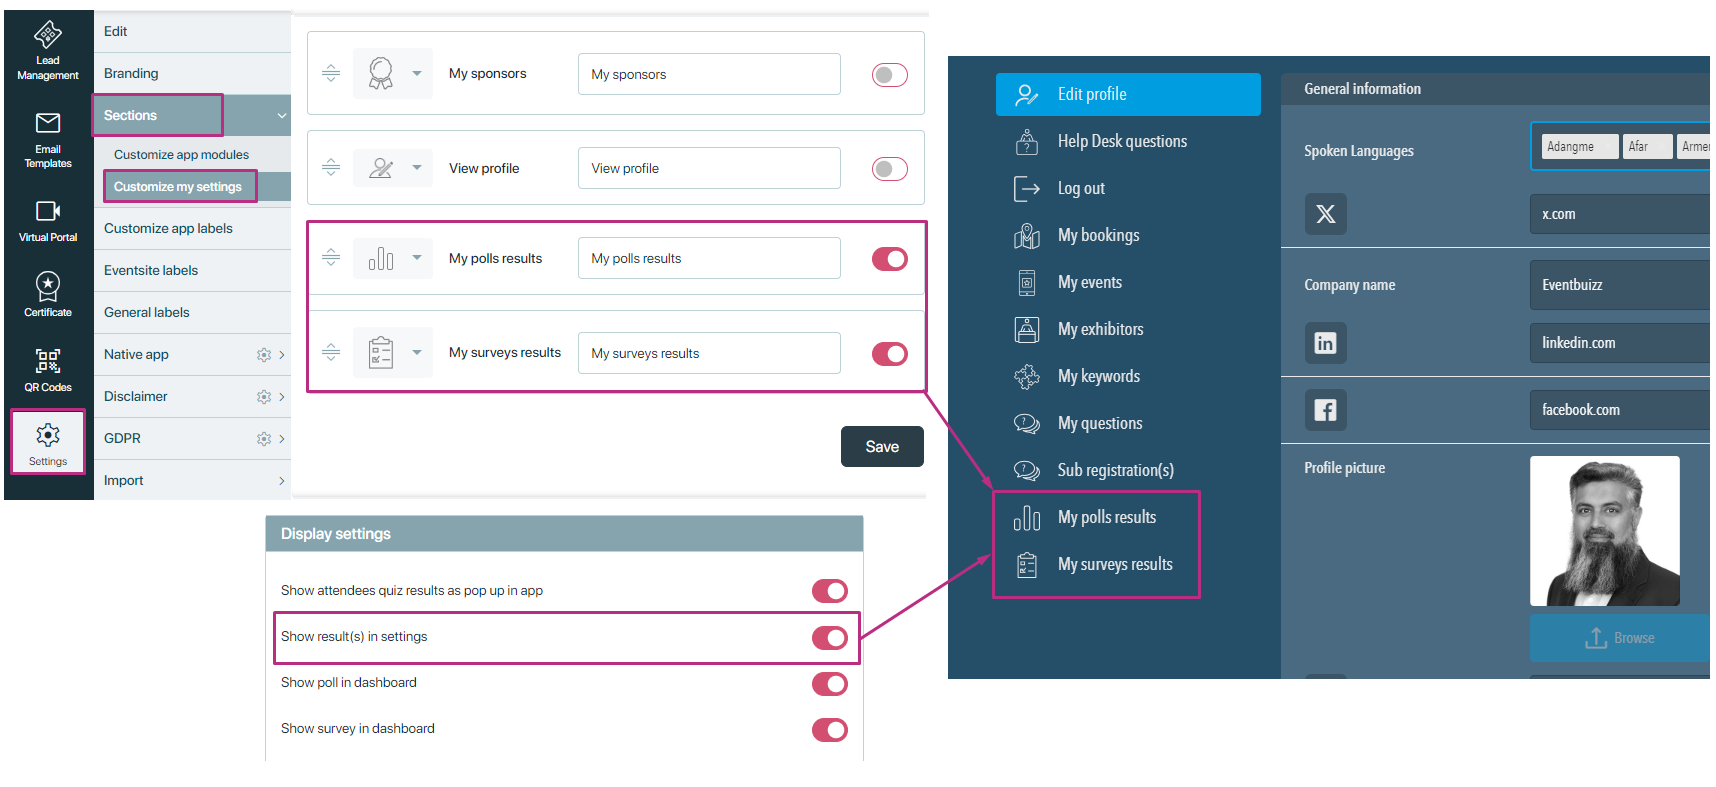
Show result(s) in settings: This option allows the quiz or poll/ survey results to be accessed in the settings menu of the app. Users can view the outcomes at their convenience by navigating to the appropriate section within the app’s settings.
To show your poll and survey results in the settings, you need to follow these steps:
- Go to Settings -> Customize My Settings and turn ON the relevant settings (my polls results/ my survey results).
- Then, in the poll/survey settings, make sure the Show result(s) in settings option is also turned ON.
NOTE: If an attendee has not answered the poll or survey, the results will not be shown in the settings, even if all the settings are turned ON.
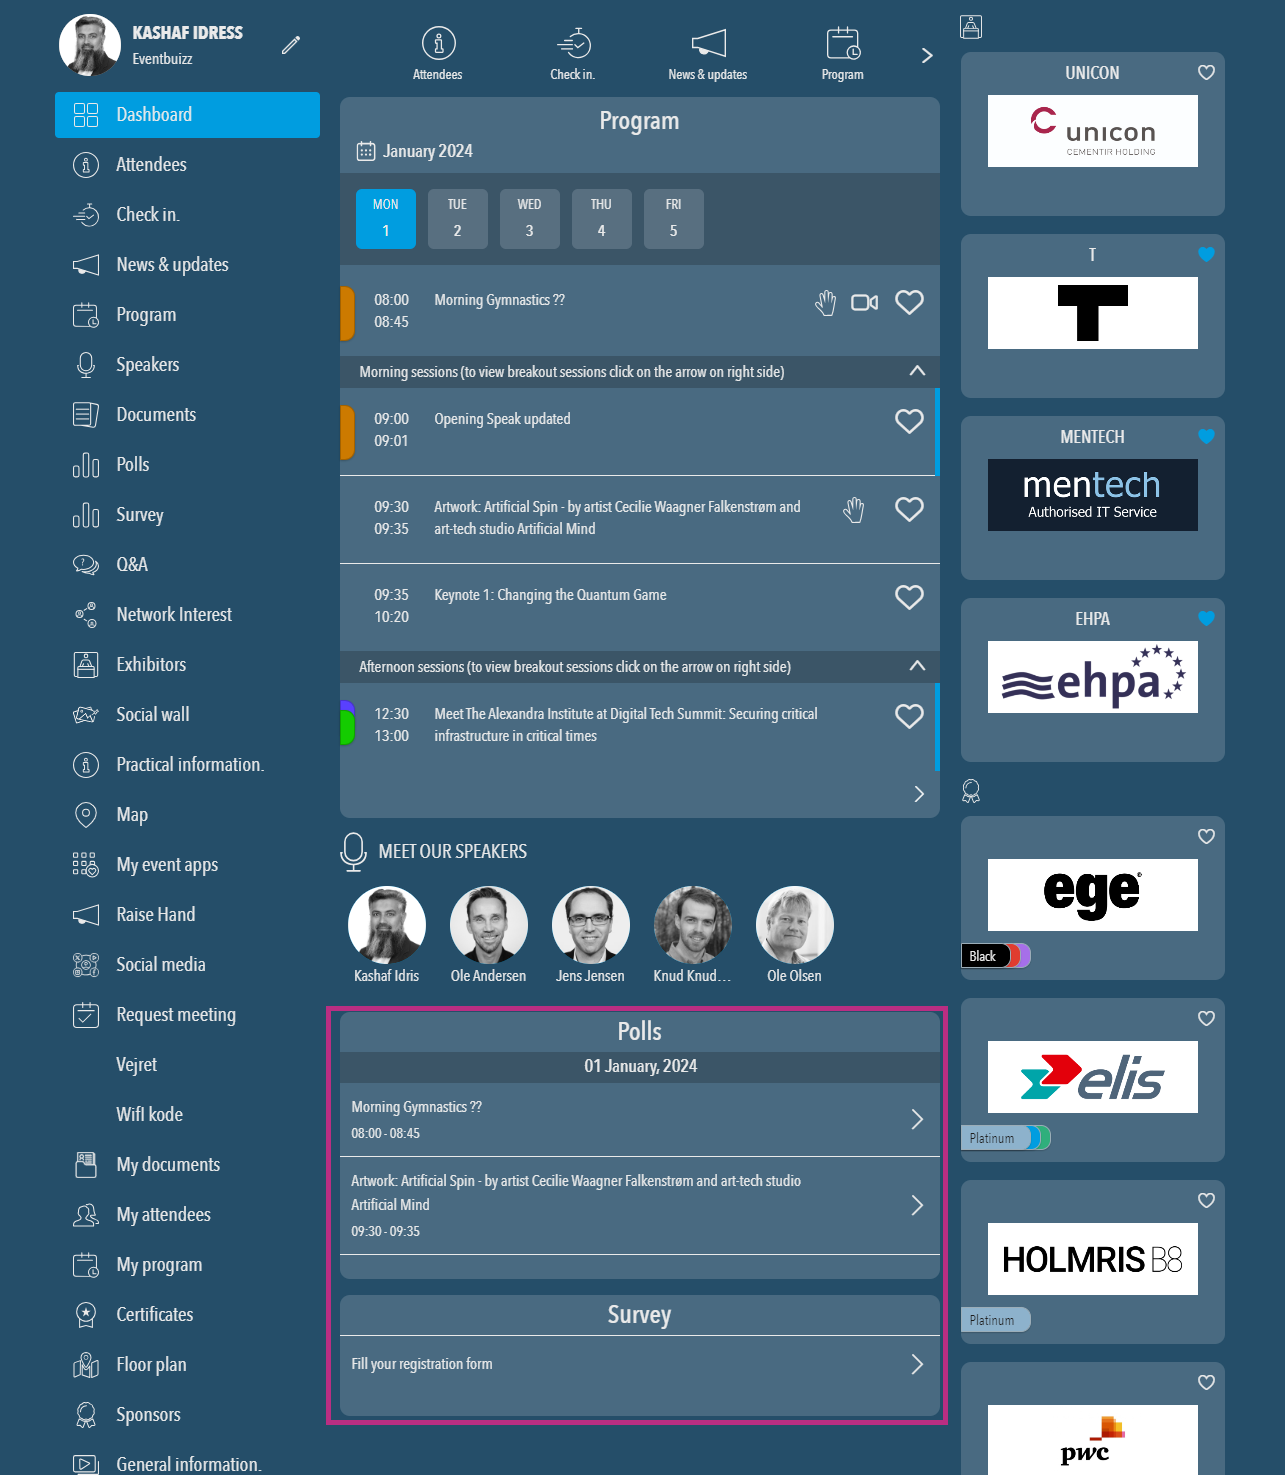
Show polls in dashboard or Show surveys in dashboard:
When you create a poll or a survey, the module polls and survey will split in two on the dashboard. If you have only one of the two active, then you can deactivate the other one from the dashboard here.
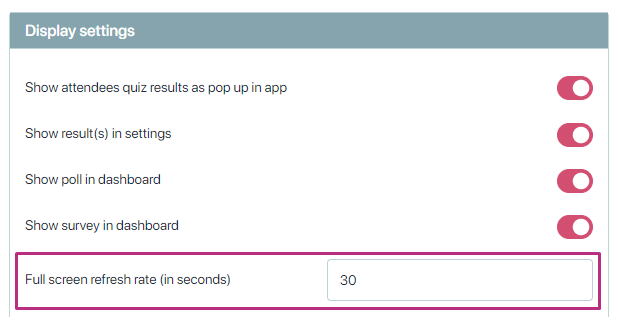
Full screen refresh rate (in seconds): This setting determines how frequently the full-screen display (such as a projector or a large screen showing poll/survey results) refreshes. A value of 30 seconds means the display will update every 30 seconds to reflect new data
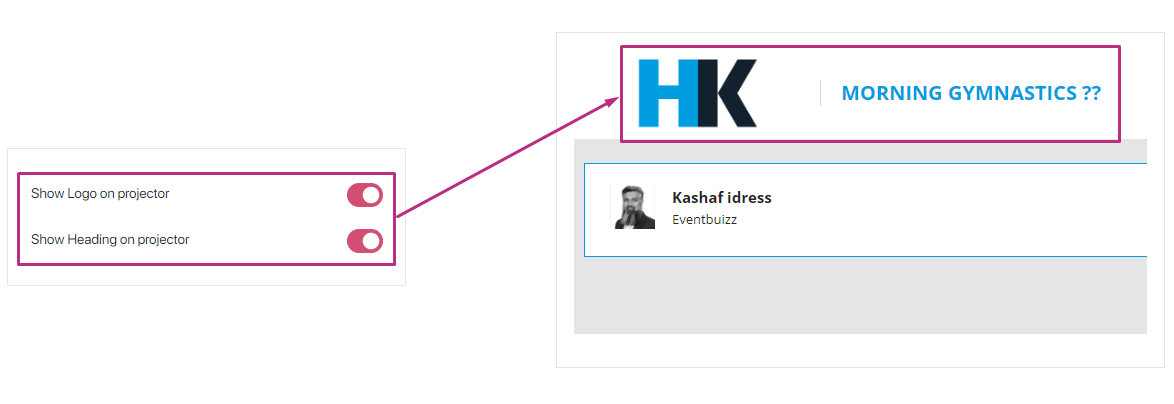
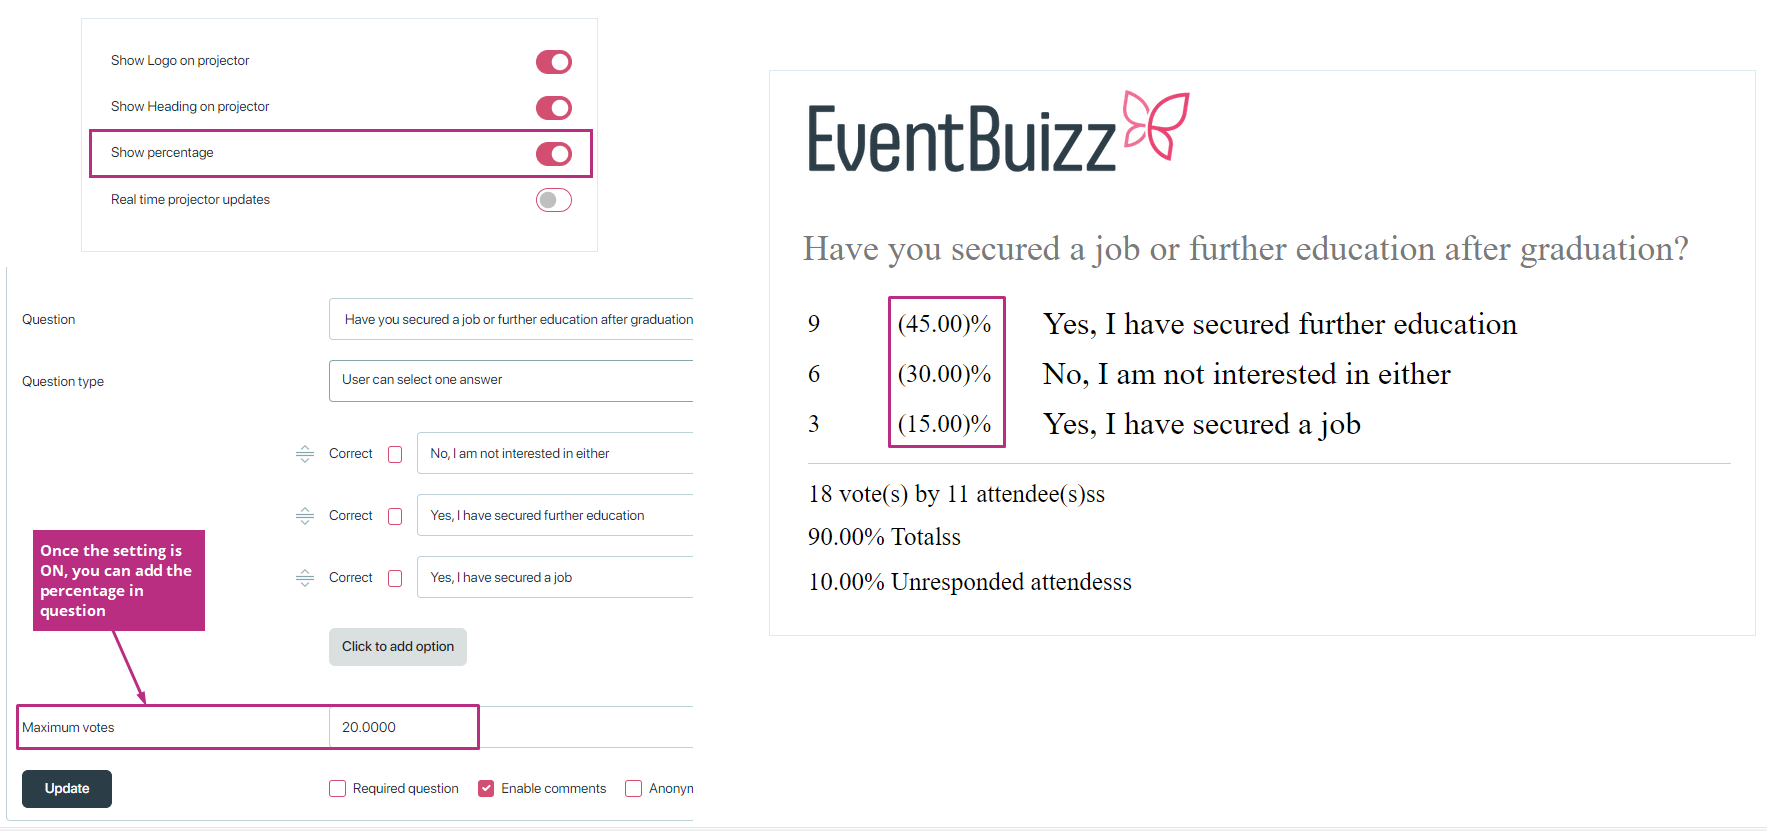
Show percentage:
This setting, when activated, shows the percentage of votes or responses for each option in the poll or survey. It helps in visualizing how responses are distributed among the choices.
You can add max votes percentage in single, multiple and drop down question type.
NOTE: You can add max votes percentage in single, multiple and drop down question type.
Real time projector updates: Enabling this setting ensures that the projector display updates in real time as new responses come in. This provides a dynamic and interactive experience for the audience. If the setting is disabled, then go to “App > Polls & surveys > settings” and enable “Real time projector updates”

Full screen answer sorting: This setting will apply on full screen projector.
-
-
- By number of votes (Descending): This option sorts the answers on the full-screen display by the number of votes in descending order, showing the most popular options first.
- Manual sorting: This allows the event organizer to manually arrange the order of answers displayed on the screen, providing control over what is highlighted.
-
Auto update word cloud: This setting automatically updates the word cloud visualization as new responses are received. A word cloud visually represents the frequency of words or phrases in the responses, with more frequently occurring words displayed in larger fonts.

Authority request settings
The authority request settings in the poll and surveys module of eventbuizz provide organisers with control over how the attendee authority sub-module operates. These settings ensure that authority delegation is managed efficiently and that attendees are informed of any changes in their participation rights. Here’s a detailed explanation of each setting:
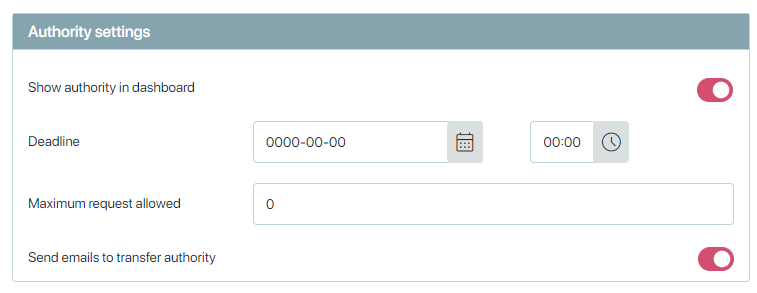
Show authority in dashboard
Description: This setting enables the Attendee Authority sub-module to be visible in the web app.
Functionality: Once this setting is enabled, the Attendee Authority sub-module will appear below the Poll and Survey menu in the web app, making it easily accessible for users to delegate or accept authority.
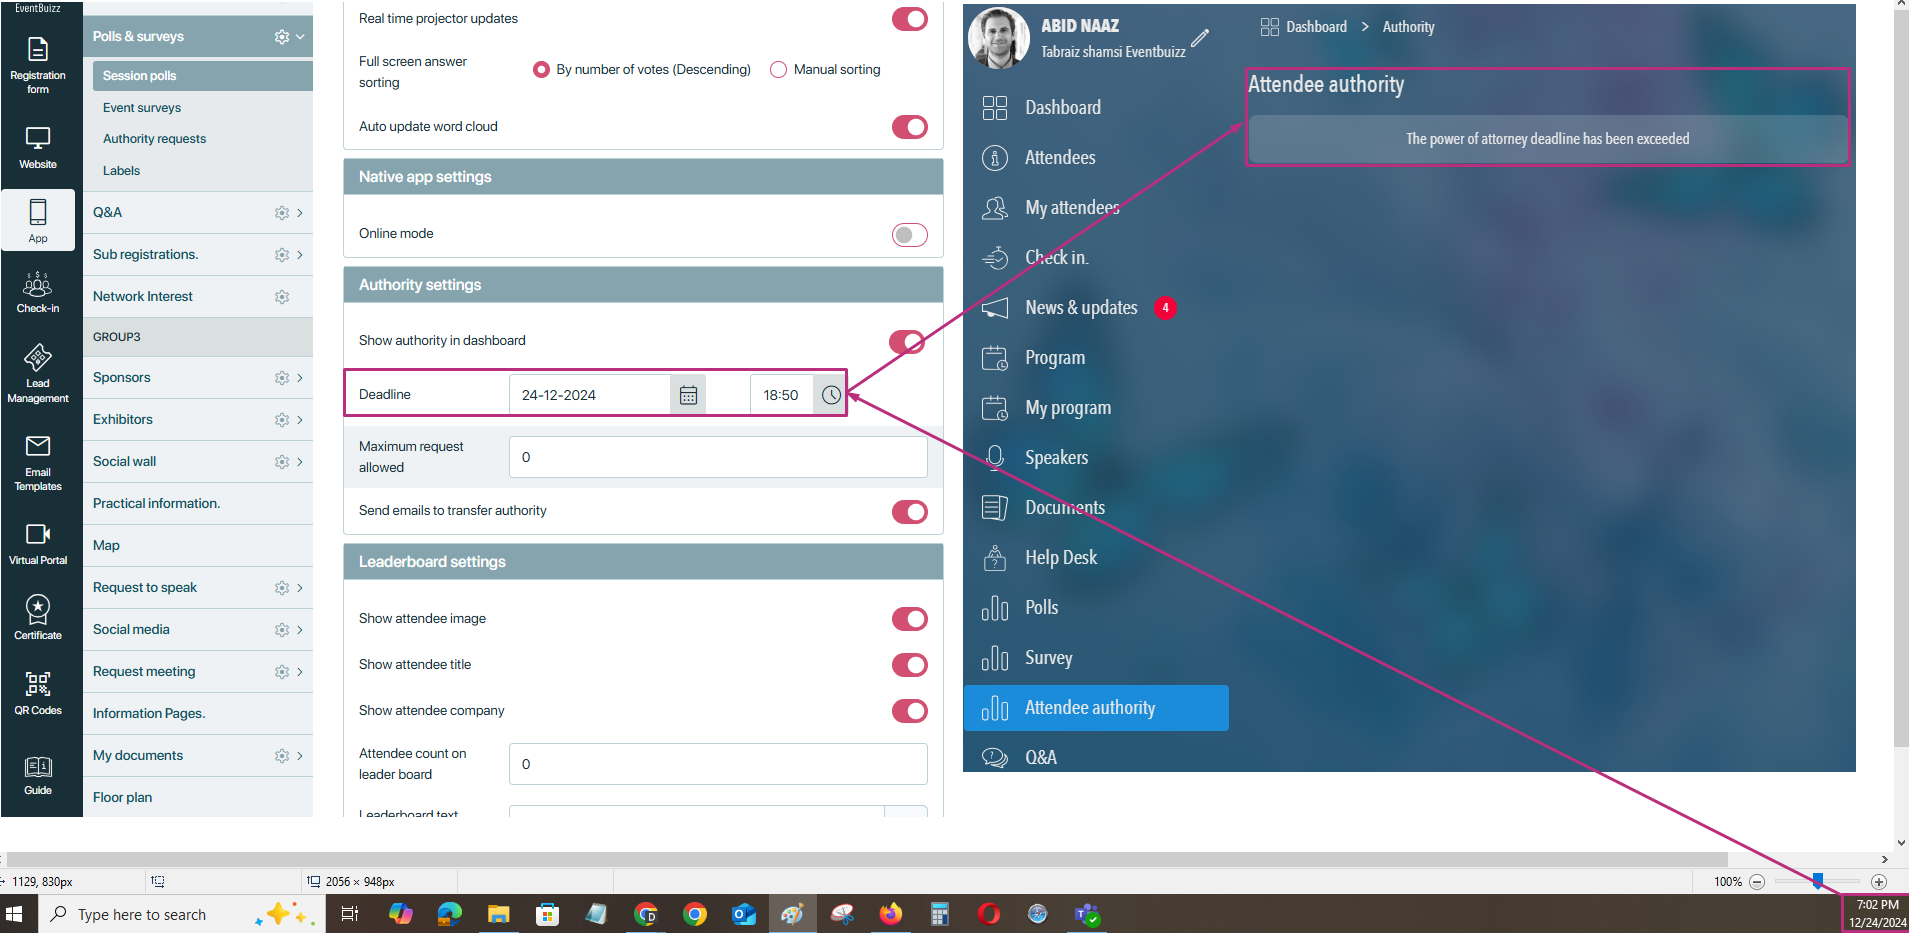
Deadline
Description: This setting provides the organizer with the ability to restrict the timeframe within which an attendee can submit polls and surveys.
Functionality: The organiser can define a specific date and time range during which the delegated authority is valid. This ensures that the submission of polls and surveys happens within an appropriate time frame, aligning with the event’s schedule and deadlines.
Maximum request allowed
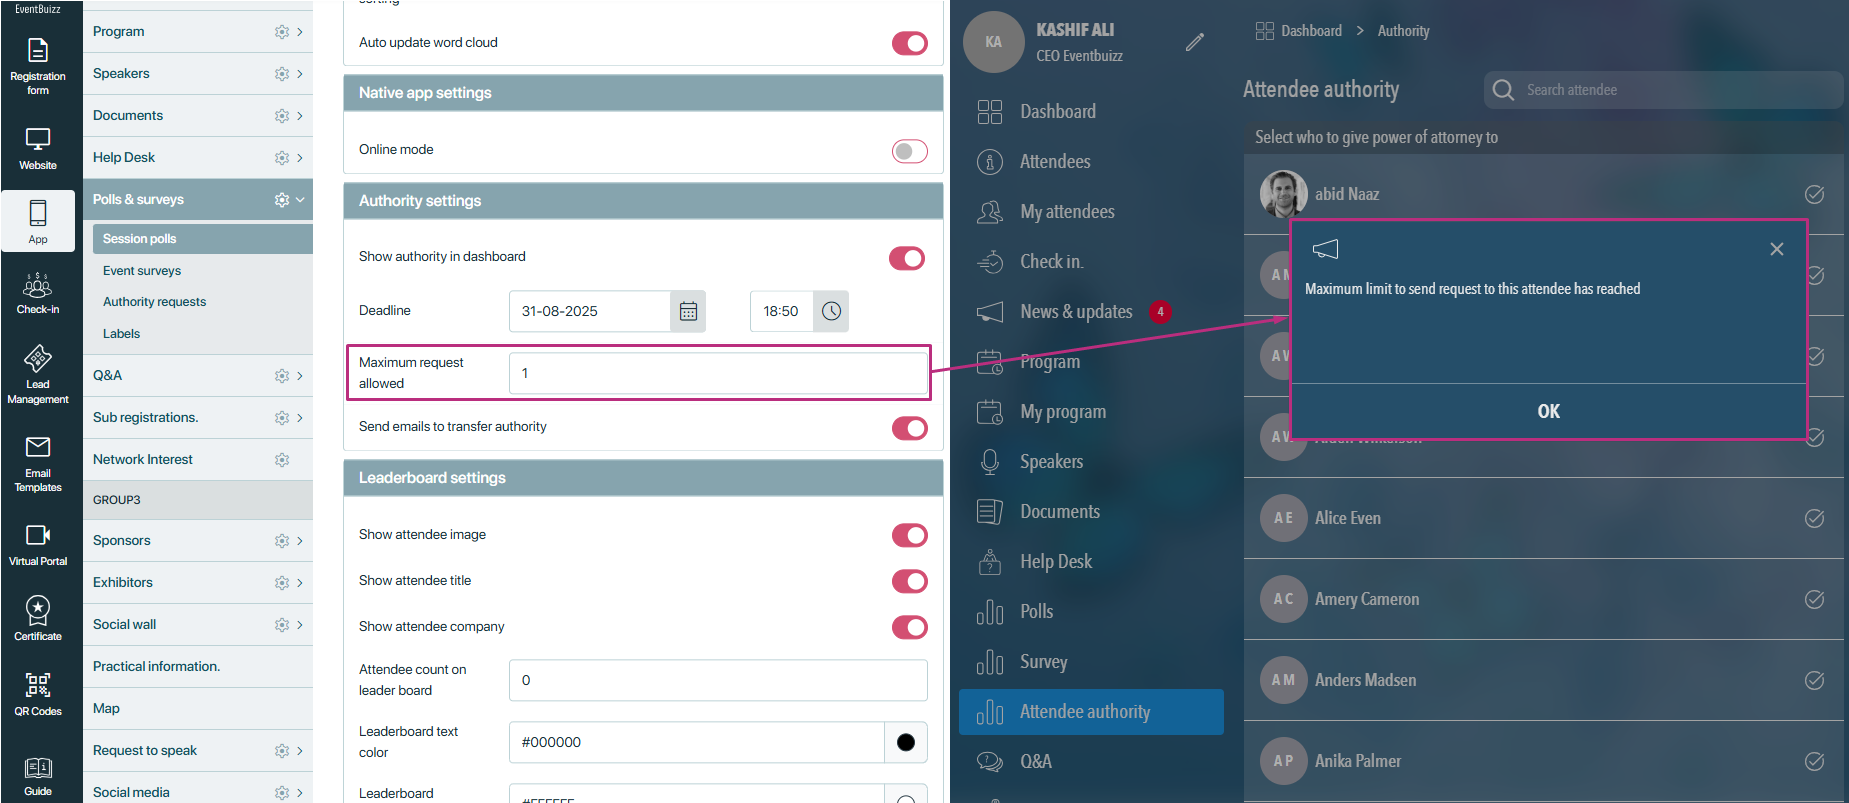
Description: This setting allows the organiser to limit the number of authority requests an attendee can accept.
Functionality: The organiser can set a specific number for how many authority requests an attendee is allowed to accept. By default, the value is set to 0, which indicates that there is no limit on the number of requests an attendee can accept. This setting helps in preventing any one attendee from being overloaded with multiple authority requests.
Email notifications
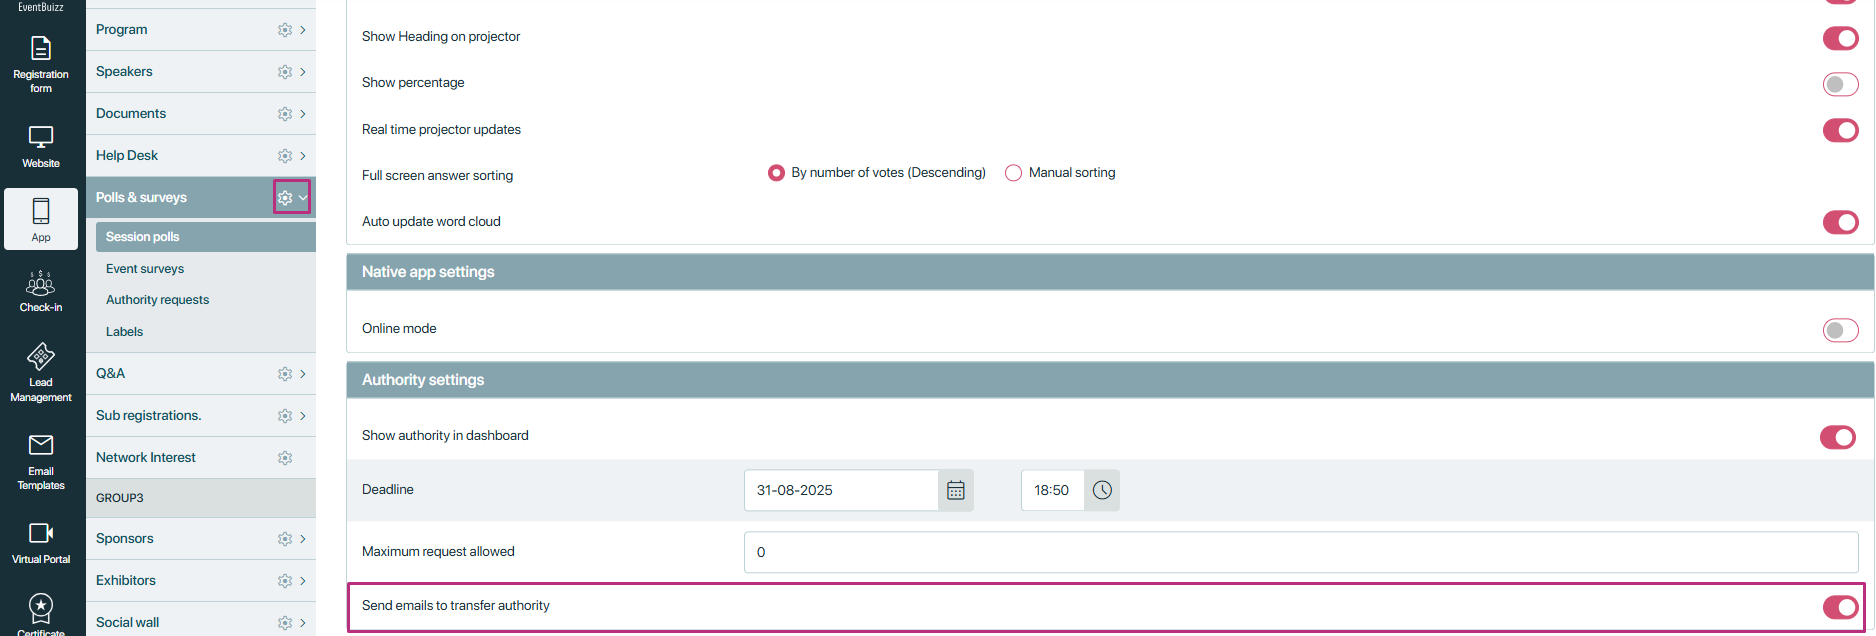
Description: This setting ensures that attendees are notified via email when authority is transferred to them.
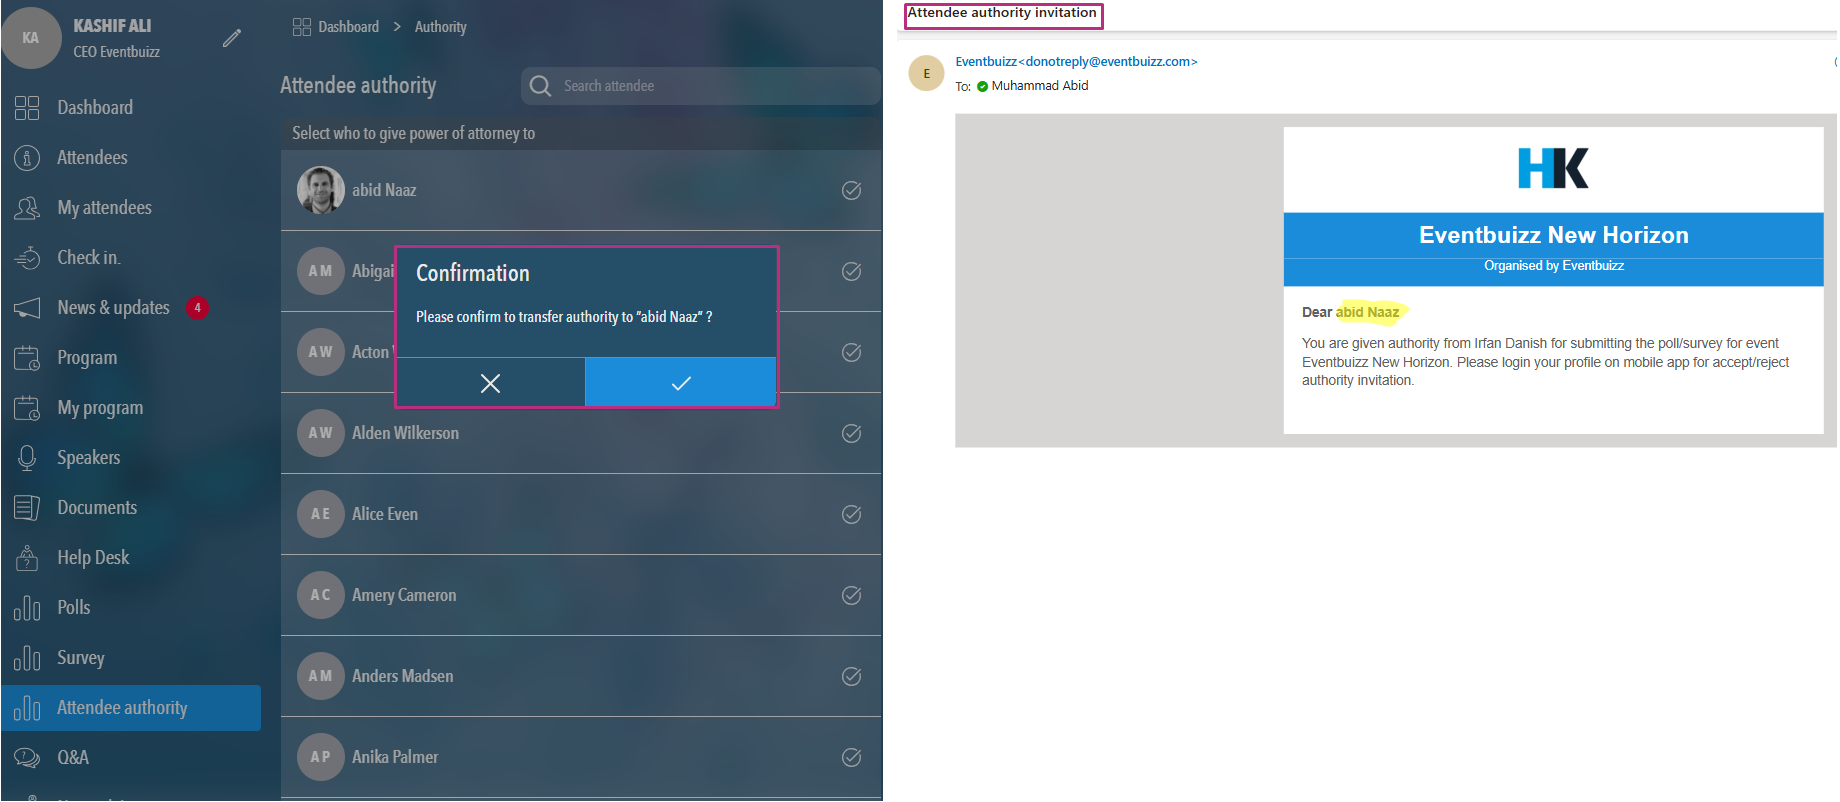
Functionality: When the “Send emails to transfer authority” setting is enabled, the recipient of the transferred authority receives an email notification. This email includes details about the transfer, ensuring that the recipient is aware of their new responsibilities and can take appropriate action promptly.
- When this setting is on, and attendee transfer request of authority, and recipient attendee accepted the request, recipient will receive an confirmation email as well.
Tag cloud settings
For sentence cloud projector, You can set up the color and font size from here:
‘Color 1’ – will be the color of the words with the highest amount – ‘Color 2’ the 2nd highest and so forth. Font size you can regulate, by pulling the pulling the ‘Font size’ line in the bottom.

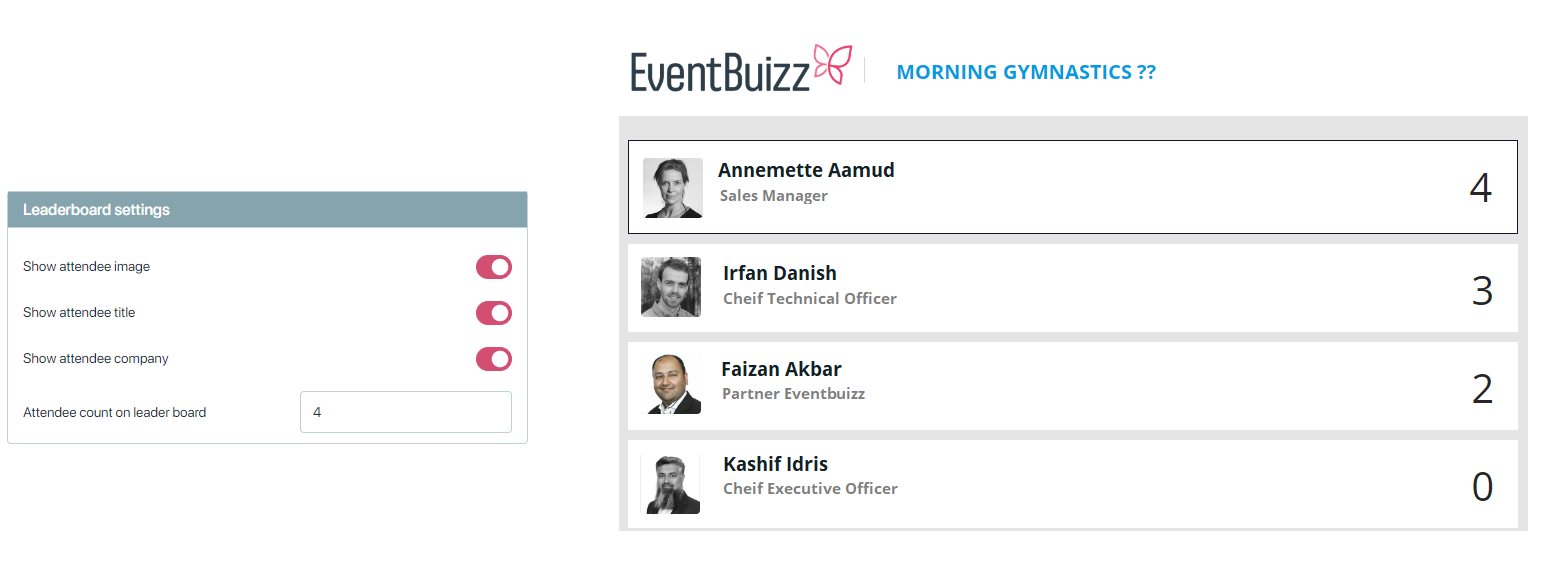
Leaderboard settings
-
Show attendee image: This setting, when enabled, displays the profile image of attendees on the leaderboard. It helps in visually identifying participants and adds a personalized touch to the leaderboard.
-
Show attendee title: When this setting is turned on, the job title or role of each attendee is shown on the leaderboard.
-
Show attendee company: Enabling this setting displays the name of the company or organization that each attendee represents on the leaderboard. It adds another layer of information, showing which companies are represented by the top participants.
-
Attendee count on leaderboard: This setting determines how many attendees are shown on the leaderboard. You can set a specific number to control how many top participants are displayed, which helps in managing the visibility and relevance of the leaderboard.
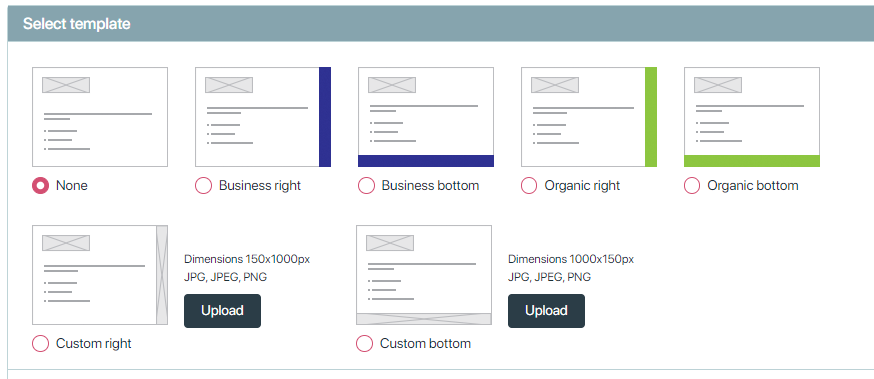
Select template
If you wish to display the results on monitor, you can choose between different template layouts – or create your own.
